User roles: ✔ All Users ✔ Project Administrator
In this article you will learn what the FluidAI Project Overview panel shows, where its content comes from, when it regenerates, who can see it, and what you can and cannot change about how it reads.
Before You Start
The FluidAI Project Overview is only available when your organisation has switched it on. An Application Administrator controls this on the FluidAI Features page in the Administration Console — see Setting Up FluidAI.
Enable FluidAI Project Summaries turns the overview on.
Enable FluidAI for Fluid Jobs must also be on. It is what produces and refreshes the overviews in the background.
While Restrict FluidAI to Project Admins is on, only Project Admins see the overview.
If you cannot see the overview on any project, ask your Fluid administrator whether these settings are on.
What It Is
The FluidAI Project Overview is a written assessment of a project that sits at the top of its workspace. It is generated in the background on a schedule, so it is already there when you open the project rather than being something you have to ask for.
It exists because a project workspace answers “what is recorded” very well and “how is this project actually doing” rather poorly. Everything needed to answer the second question is present — across risks, financials, schedule, resourcing, benefits, status reports and governance — but assembling it means opening seven sections and holding the result in your head. The overview does that reading and writes down the conclusion.
It belongs to the project, not to you. Everyone with access sees the same overview, which is what makes it usable as a shared starting point in a review meeting.
Where to Find It
Open any project workspace. The panel appears at the top, headed FluidAI Project Overview.
If the settings above are on but a project has no panel, it does not have an overview yet. The panel stays hidden until the first one is produced — after the project’s next governance assessment, or in the weekly run.
What the Panel Shows

The header shows the date the overview was generated and how many dimensions were assessed. An overall assessment badge sits on the right, alongside a Theme — a one- or two-word tag for the project’s current state: On Track, Late, At Risk, Issues, Completed, On Hold or New.
The headline is a single bold sentence giving the reason behind the overall assessment. If you read nothing else, read this.
The general narrative follows it — a short paragraph on governance health and delivery trajectory.
The dimension row shows each assessed area as a coloured pill with its own rating. General is not shown as a pill — it is the narrative above — so you will see at most six. Selecting any pill expands the panel.
The focus line appears when something needs attention, reading for example “2 areas to focus on” followed by their names. This is the fastest read in the whole panel.

Expanding the panel adds three more things:
A paragraph per dimension, each with its rating. Anything rated as needing improvement is highlighted and tagged Suggested focus. Where a dimension corresponds to a section of the workspace, the expanded row offers Go to … in the workspace to take you straight there.
What changed, describing what moved since the previous overview. It is empty the first time an overview is produced. On a project you review regularly this is often the only part you need.
An advisory comparison against your own status RAGs, in its own bordered box. It is explicitly labelled advisory, and it is discussed below.
The Ratings Are Not Your RAGs
Each dimension is rated Good, Borderline or Needs Improvement, or shows as Not assessed where there was nothing to go on.
That vocabulary is deliberately not Red, Amber and Green. These are FluidAI’s own assessment of the recorded evidence; your RAG statuses are a judgement made by the people running the project, against thresholds your organisation configured. Using the same words for both would suggest an authority the overview does not have and is not trying to claim.
The two disagreeing is normal and often the most useful thing on the panel. A project reporting green whose schedule dimension reads Needs Improvement is either a reporting problem or a data problem, and either way it is worth ten minutes of somebody’s attention. That is what the advisory comparison box is for — it says how the AI assessment lines up against the RAGs your team set, and stops there. It never changes a RAG. Only a person does that.
What Each Dimension Looks At
Seven dimensions are assessed. Knowing what each one is looking for explains most of what you will read, and all of what you will not. The table describes Fluid’s built-in checks; an administrator can replace them per governance model — see What You Can Change.
Dimension | What it is looking for |
General | Overall governance health and delivery trajectory. A failing governance assessment, missing ownership roles, and stage gates — gates open with no approver, gates past a decision due date, and exit gates still open for the current phase. |
Risks | Red or high-impact and overdue risks and issues, missing mitigations or owners. No risks logged at all is called out as a governance gap rather than treated as good news. |
Financials | A missing or absent forecast, estimate at completion materially exceeding budget or released funding, and significant over- or under-spend. |
Schedule | Overdue milestones by name with their dates, milestones due in the next two weeks, an empty or unbaselined schedule, and slipped or at-risk milestones. |
Resourcing | Gaps in key roles, over- or under-allocation, and notable churn in the project community. |
Benefits | Benefits or objectives not defined at all, and benefits that appear to be at risk or unmeasured. |
Status | A stale status report (roughly older than two weeks) or none at all, the RAG trend across the last three reports, and overdue or blocking stage gates awaiting a decision. |
You may see fewer than seven. A dimension is hidden where the corresponding capability is not enabled for your organisation, where the project type does not include that part of the workspace, where it has been switched off in the project’s governance model, or where you do not have permission to see it — a tenant not using Fluid for financials will not get a Financials dimension.
When It Regenerates
Overviews are produced in the background. You do not need to do anything, and there is no benefit in waiting on the page. A project’s overview is regenerated:
after each governance assessment of the project — where your organisation runs governance assessments, these run overnight, so the overview follows them; and
in a weekly run early on Sunday morning, for active projects whose details, schedule, risks and issues or financials changed in the previous seven days.
Users who can edit the project also get a Refresh overview button in the panel header. It queues a new overview — re-running the project’s governance assessment first, where governance assessments are switched on — which is worth doing after a significant update — closing a run of risks, rebaselining, or filing a status report you want reflected before a review.
Refreshing takes a little time because the whole overview is produced again. The panel shows Refreshing… while it waits. If the new overview has not arrived after about half a minute it says Still working - reload to see the update; reload the page a little later. The new overview replaces the old one for everybody, not just for you.
What You Can Change
What each dimension looks for is set on the project’s governance model. Open the governance model and select FluidAI Summary in its side navigation. The AI Summary Guidance section lists the dimensions. For each one you can:
switch it off with its Enabled toggle, so it is left out of the overview;
write your own guidance for what the dimension should look for — this replaces Fluid’s built-in checks for that dimension; or
start from a predefined prompt with Choose A Predefined Prompt, and edit it.
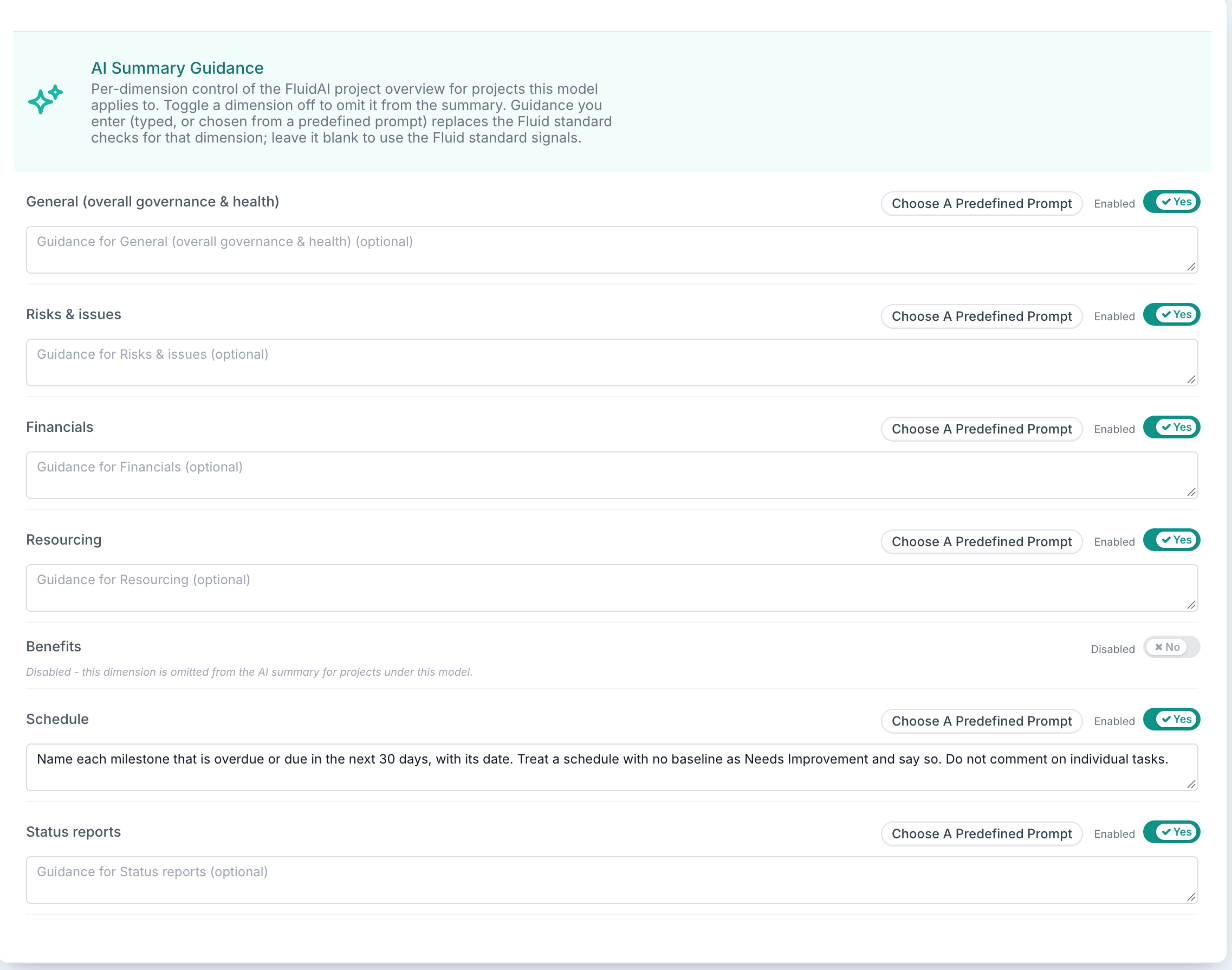
Leave the guidance blank to keep Fluid’s built-in checks, described in the table above. The section is only shown when Enable FluidAI Project Summaries is on. The advice in Writing Good AI Guidance applies here too: say what to look for, and what to call out.
A change applies to every project the governance model covers, not to one project. Each project picks up the change the next time its overview is produced.
With governance on, a project’s overview uses the governance model the project is assessed against, including any AI Summary Guidance set on it.
With governance off, a project has no governance model, so there is nothing to change: its overview uses Fluid’s built-in checks described in the table above. The overview itself still works.
Beyond the guidance, you control:
Whether it runs at all — Enable FluidAI Project Summaries.
Who sees it — Restrict FluidAI to Project Admins limits the panel to Project Admins; refresh is limited to users who can edit the project.
Which dimensions appear — through the governance model, as above, through the workspace sections shown for the project type, and through which Fluid capabilities you have enabled.
What it has to work with. This is the real lever, and it is a much bigger one than it sounds. Read the next section.
Guidance and Bias
The overview has a deliberate bias, and understanding it will save you arguing with it.
It treats absence as a finding. No risks logged, no benefits defined, no forecast, no recent status report — each is called out rather than passed over. A project with almost nothing recorded will therefore read badly even if it is going perfectly well in reality.
This is intentional. For a governance tool, an empty risk register is a fact about the project’s management, not a neutral state. But it has a consequence worth being honest about with your teams: the overview measures what is recorded in Fluid, and a project managed largely outside Fluid will be assessed as though the gaps were real. The first reaction to an unfairly harsh overview is usually indignation; the second, usually correct, is that the project’s record does not reflect the work.
That is also why improving your data is the effective way to change what the overview says. Not as a trick to game it — the overview reads the same evidence a reviewer would, so the things that make it read better are the things that make an audit go better.
Two more biases worth knowing:
It is recency-weighted. A stale status report and an overdue milestone carry more weight than older, resolved history. A project that was in trouble and recovered reads better than its full history would suggest — which is usually right, and occasionally hides a pattern.
It is even-handed across dimensions. It does not know that, for your organisation, benefits tracking is aspirational while schedule adherence is contractual. It will report a benefits gap with the same seriousness as a schedule slip. Read the dimensions you care about and discount accordingly.
If an overview is wrong rather than merely unwelcome, refresh it first — a stale assessment written before a batch of updates is the most common cause. If it is still wrong after that, raise it with your Fluid administrator, who can see whether the same problem is appearing across projects.
Using It Well
Read “What changed” first on a project you know. The full overview is for a project you are meeting for the first time.
Treat a disagreement with your RAG as a question, not a verdict. It is usually a reporting gap, sometimes a data gap, occasionally a real one that has been missed.
Refresh before a governance forum, not during it.
Do not read it out in a review meeting. It is a starting position that means the meeting can begin at the second question rather than the first. If it becomes the report, you have replaced a conversation with a summary of the data you already had.
It is generated by AI and can be wrong. Check anything surprising against the underlying record before repeating it — every claim it makes is traceable to something in the project, and selecting a dimension takes you to that part of the workspace.