
June 2025 Release Notes
27th June Release (15.2.29846)
Enhancements and Fixes
Resource dashboards: We've made a number of behind-the-scenes enhancements to improve the accuracy and reliability of the Resource Dashboards. These changes ensure that team filters reflect the latest resource plans more consistently, placeholders are only shown when relevant, and capacity figures are aligned across views. Together, these improvements give PMOs and delivery managers greater confidence in the data when planning, reviewing, and reporting on resource usage.
Resource Allocation Actuals on Project Workspace: Fixed an issue where financial actuals were not appearing in the community component when a project had actuals recorded against both financial and non-financial references across multiple resources.
24th June Release (15.2.29806)
Assign tasks by project role in bulk schedule uploads
You can now assign schedule tasks to project roles (e.g. Project Manager, Owner) when using the schedule bulk edit file. Fluid will automatically map the role to the correct user based on the project setup. This works for both project templates and direct schedule updates, making schedules more reusable and reducing manual assignment effort.
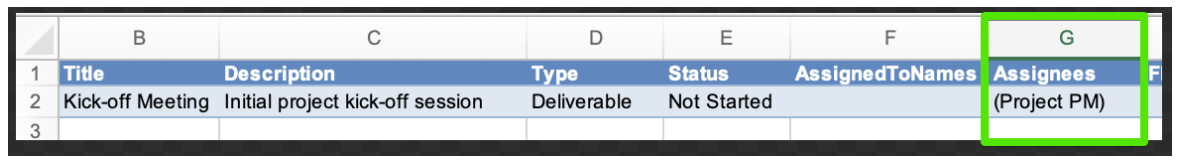
To assign by role, enter the role name in brackets in the Assignees column (e.g. (Primary PM)). When the file is uploaded, Fluid checks who holds that role on the project and assigns the task accordingly. If you're using schedule-based allocation, you can also specify hours directly (e.g. (Primary PM)[8h]) or use the Flex Hours column.
You can read more about this new feature here.
Fixes
Pre-Meeting Agenda Emails: Updated the email layout to use HTML formatting instead of plain text, resolving issues with poor rendering and improving readability.
18th June Release (15.2.29755)
Enhancements and Fixes
Non-Resource Costs: Added validation during forecast and actuals upload to flag dates that are not in a valid format.
Timesheets: Fixed an error when saving timesheets after zeroing out entries.
Meeting Minutes PDF: Resolved a layout issue where large content in rich text fields could overlap across page breaks.
Delivery Teams: Fixed an issue where the full-page view of actions and decisions did not filter correctly to show only items related to team members.
11th June Release (15.2.29702)
New – Resource Allocation & Capacity Dashboards
This release introduces major improvements to the Resource Dashboards, aimed at helping Delivery Team Managers, Project Managers, Portfolio Managers and PMOs gain better visibility over how their resources are allocated and where available capacity still exists.
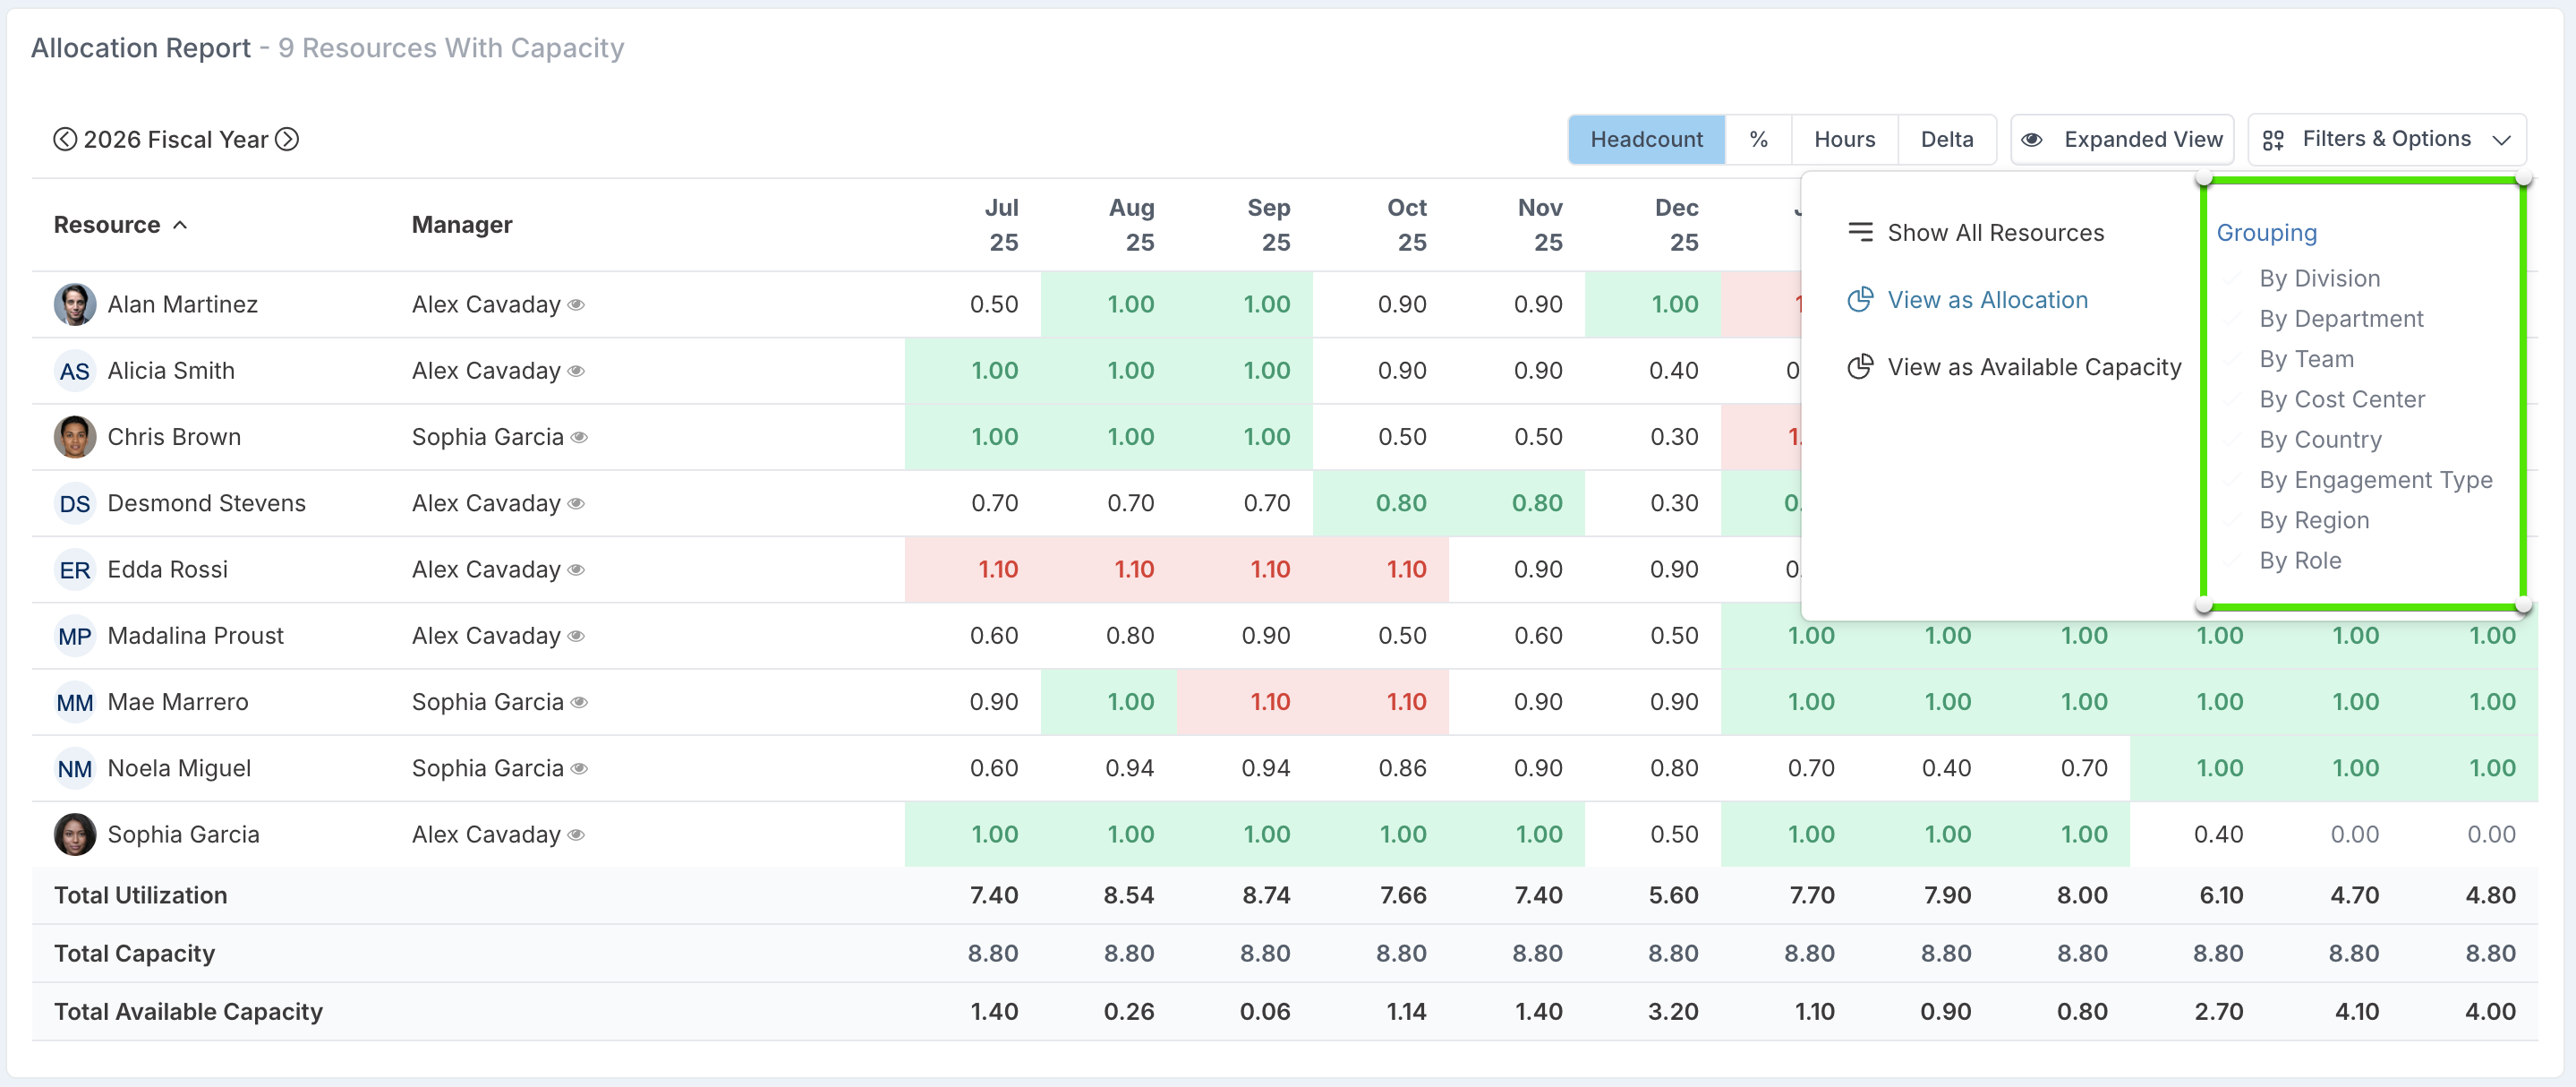
The dashboards now offer two views: Allocation Report and Capacity Report. You can toggle between them using the 'Filters & Options' menu in the top-right of the dashboard. Each view allows you to choose how you’d like to see the data - by headcount, percentage, or hours - making it easier to monitor team usage in the format that works best for your planning process.
Allocation Report View
This view has been enhanced to provide more granular and actionable insights.
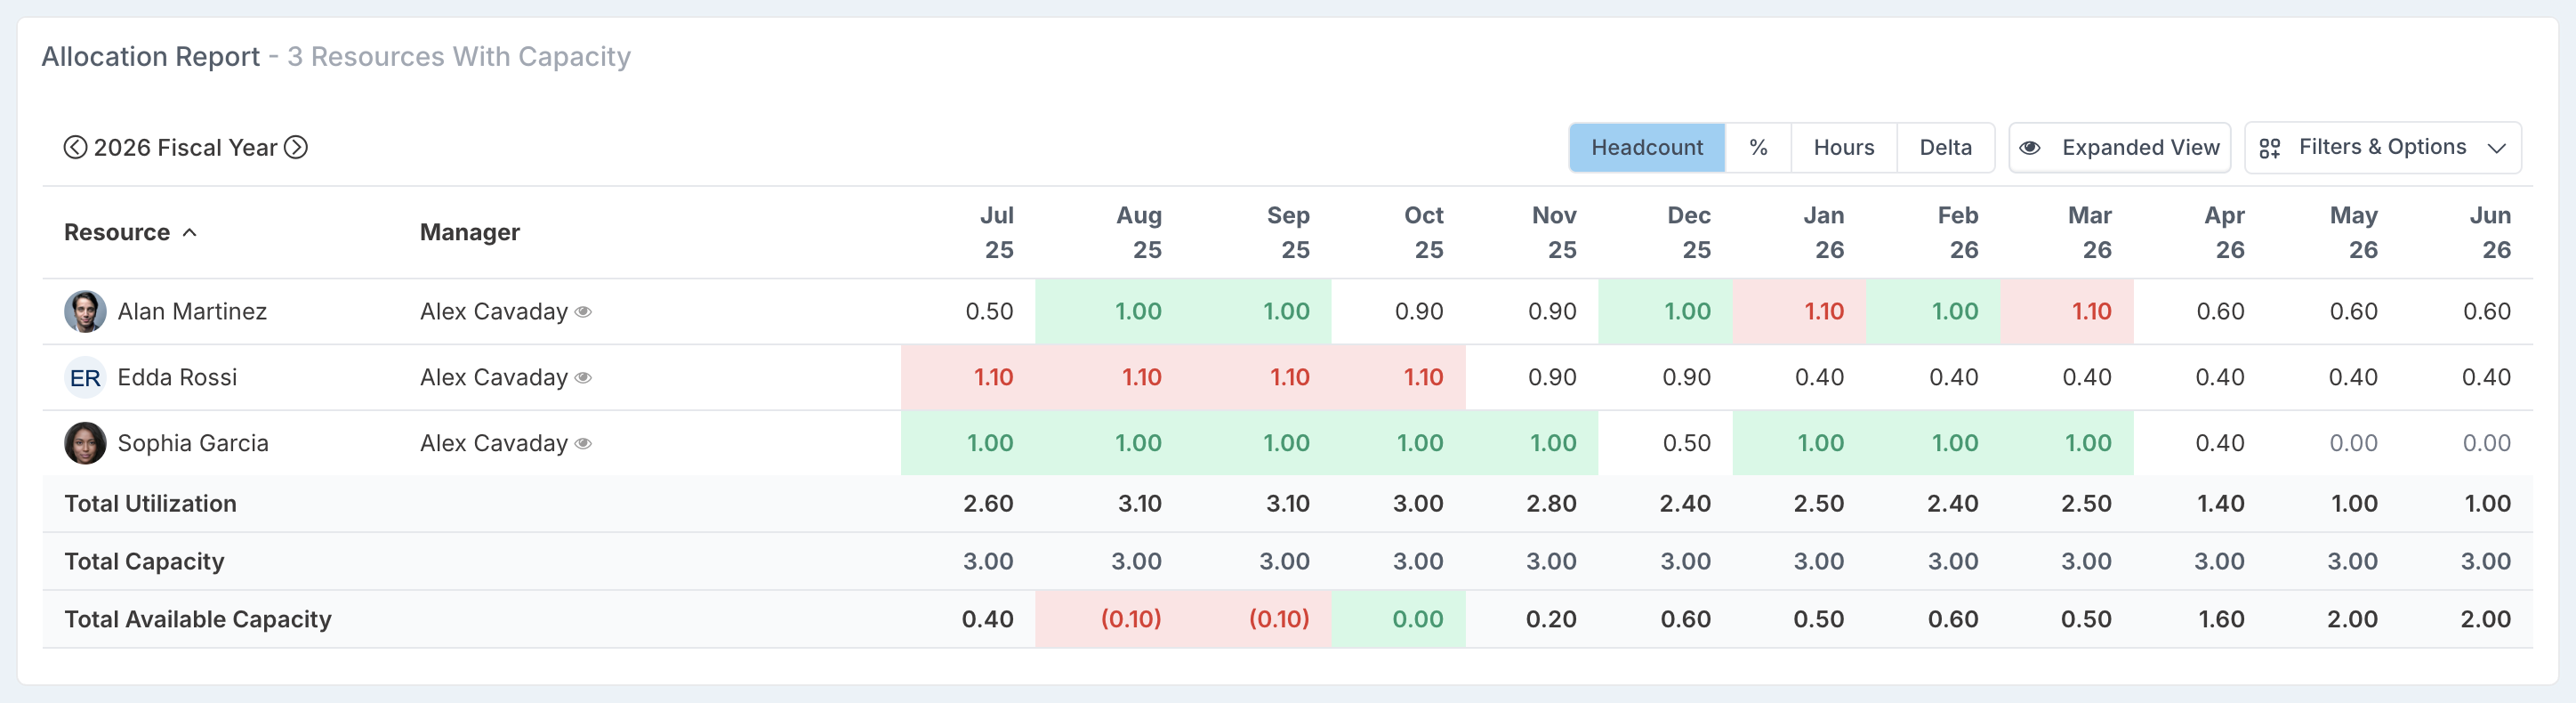
Use the Headcount, %, or Hours tabs to see allocations in different units. The Delta tab compares forecasted allocations with actual time booked (e.g. via timesheets), helping you identify where planned work and actual delivery are not aligned.
Highlighting Over and Under allocation: Monthly allocations are now visually flagged:
Red background indicates over-allocated resources.
Green background means the resource is fully allocated.
No background shows the resource is under-allocated.
Improved Grouping and Filtering: You can group resources by Delivery Team, Role, Engagement Type, Country, Region and more. This makes it easier to report on resourcing across specific teams or portfolios and identify gaps or overloads.
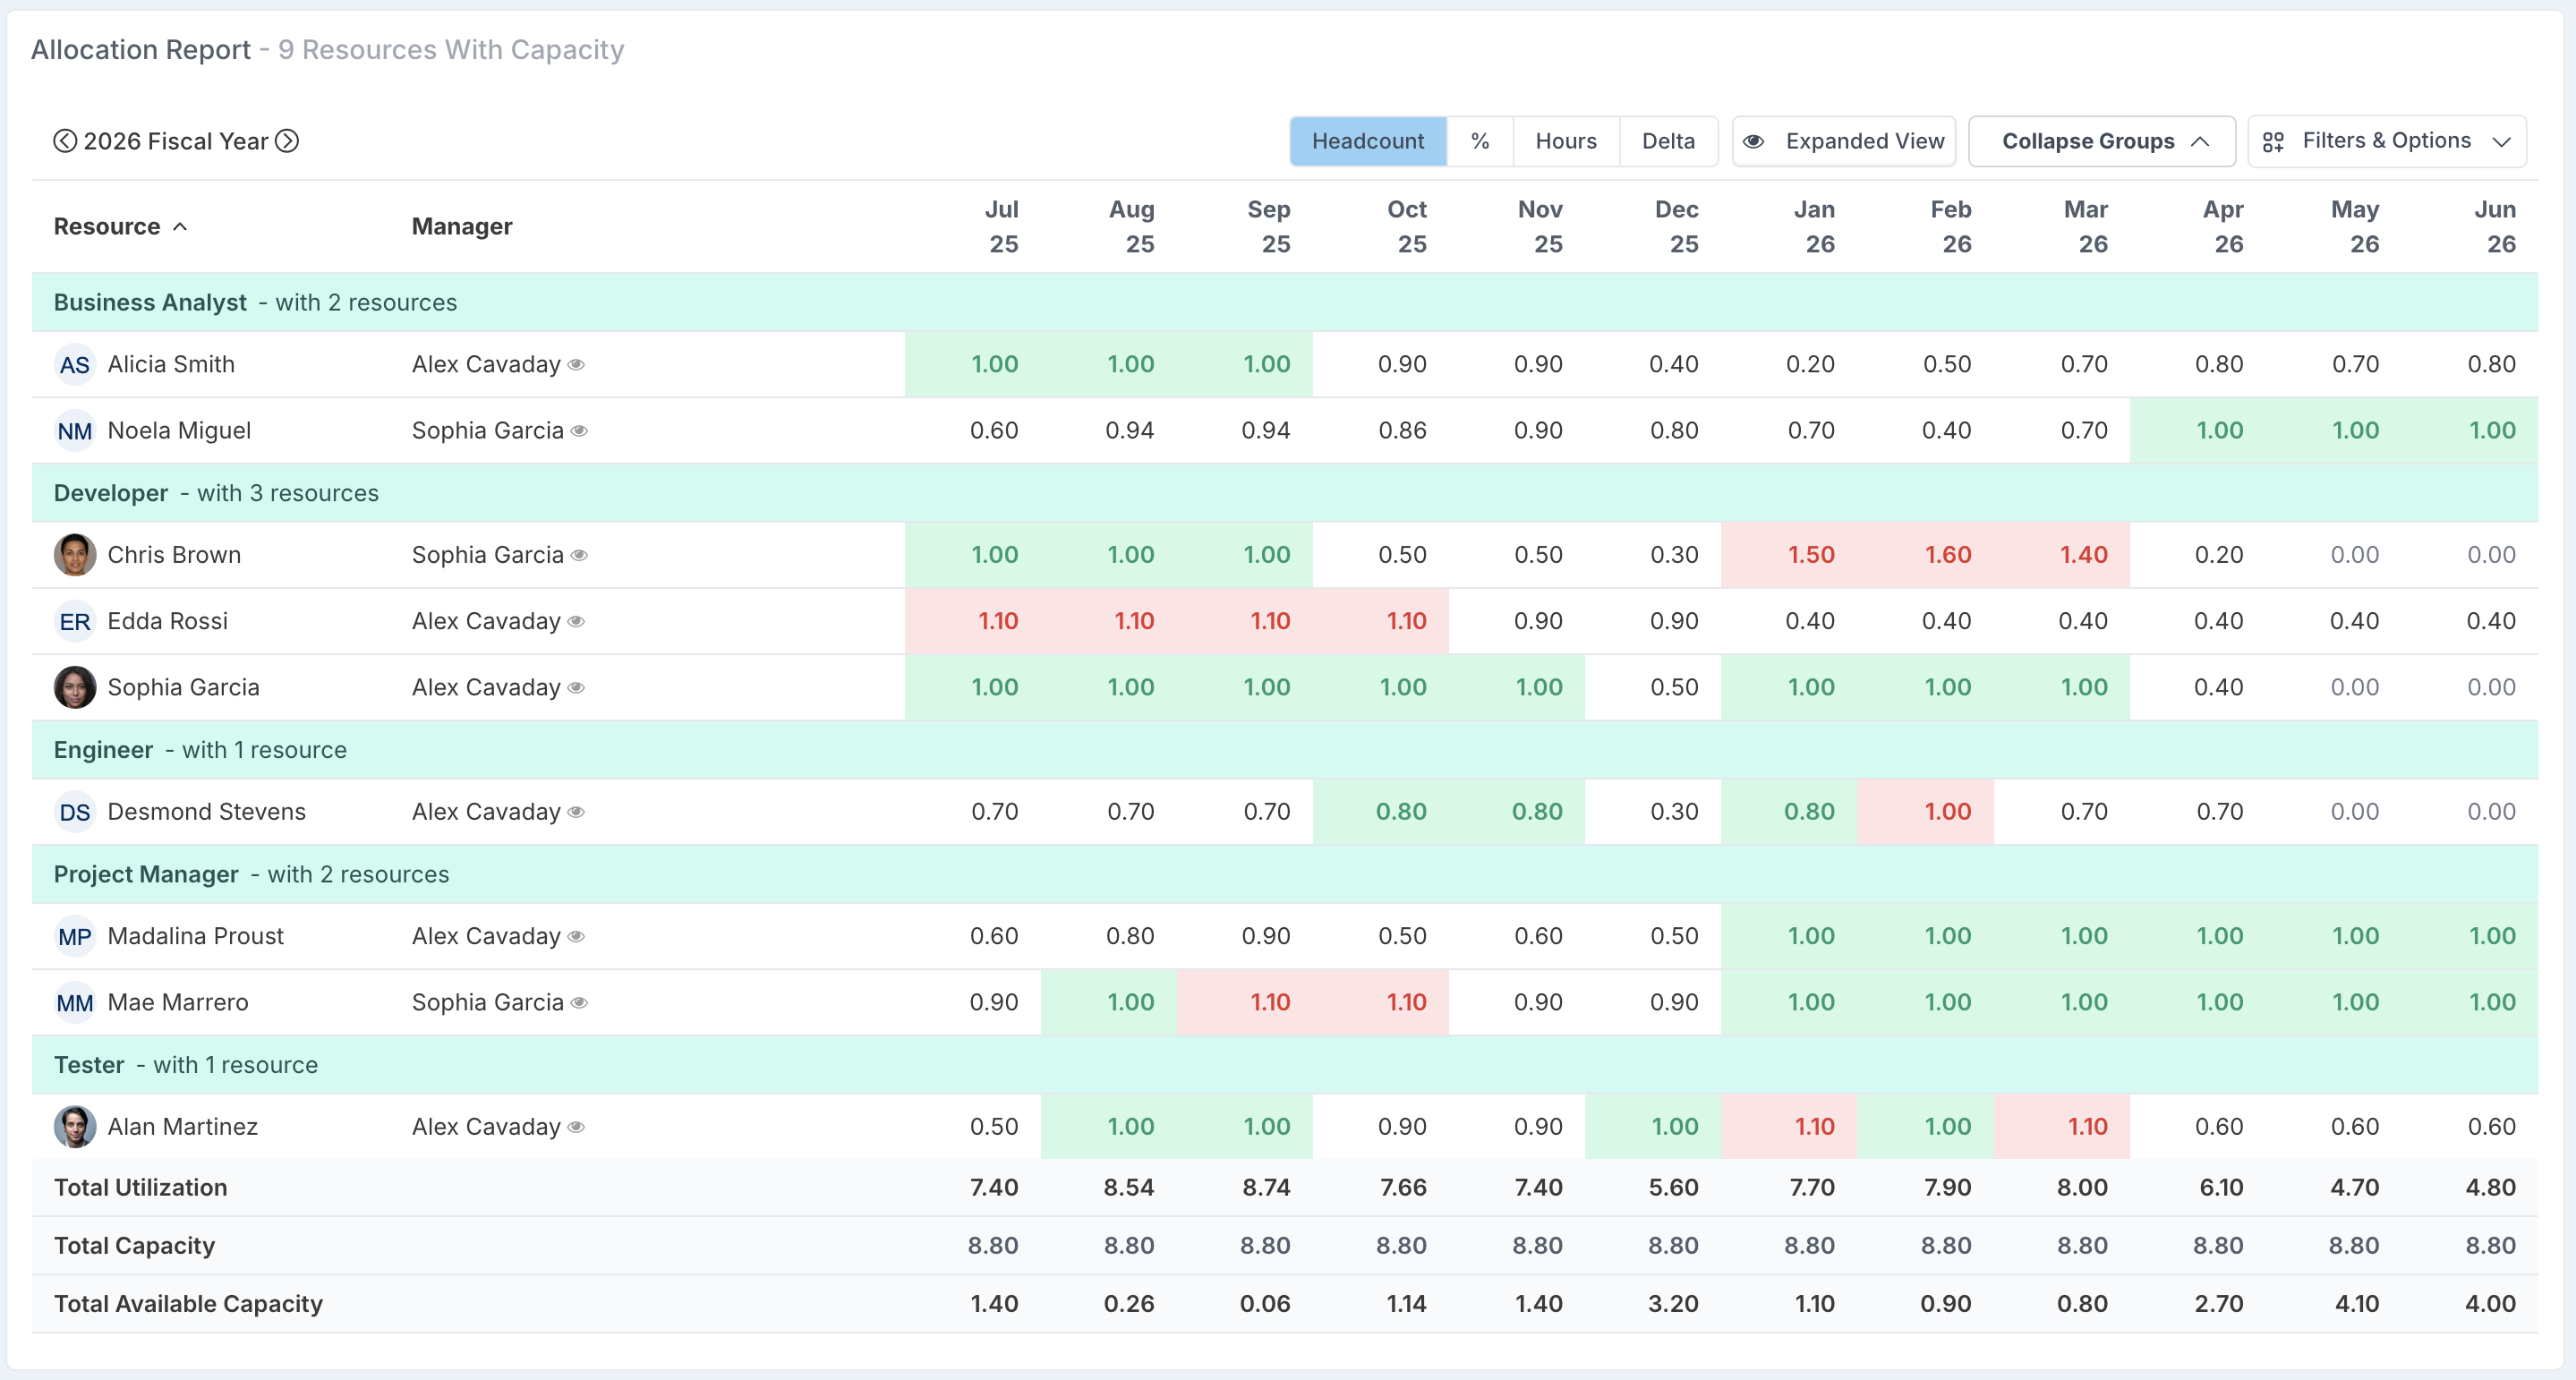
Expanded View – Project Breakdown: Select Expanded View to see a detailed breakdown of each resource’s allocation by project, providing additional context for reviewing individual workloads and cross-project commitments.
Quick Totals: Each tab shows total allocated effort, the defined capacity, and the remaining available capacity - so you can quickly see whether you're within limits or need to adjust resourcing.
This view helps you stay on top of who is overbooked, who still has bandwidth, and whether you’re aligning plans with actual delivery.
Capacity Report View (New)
This is a new dashboard designed to show remaining capacity across your teams.
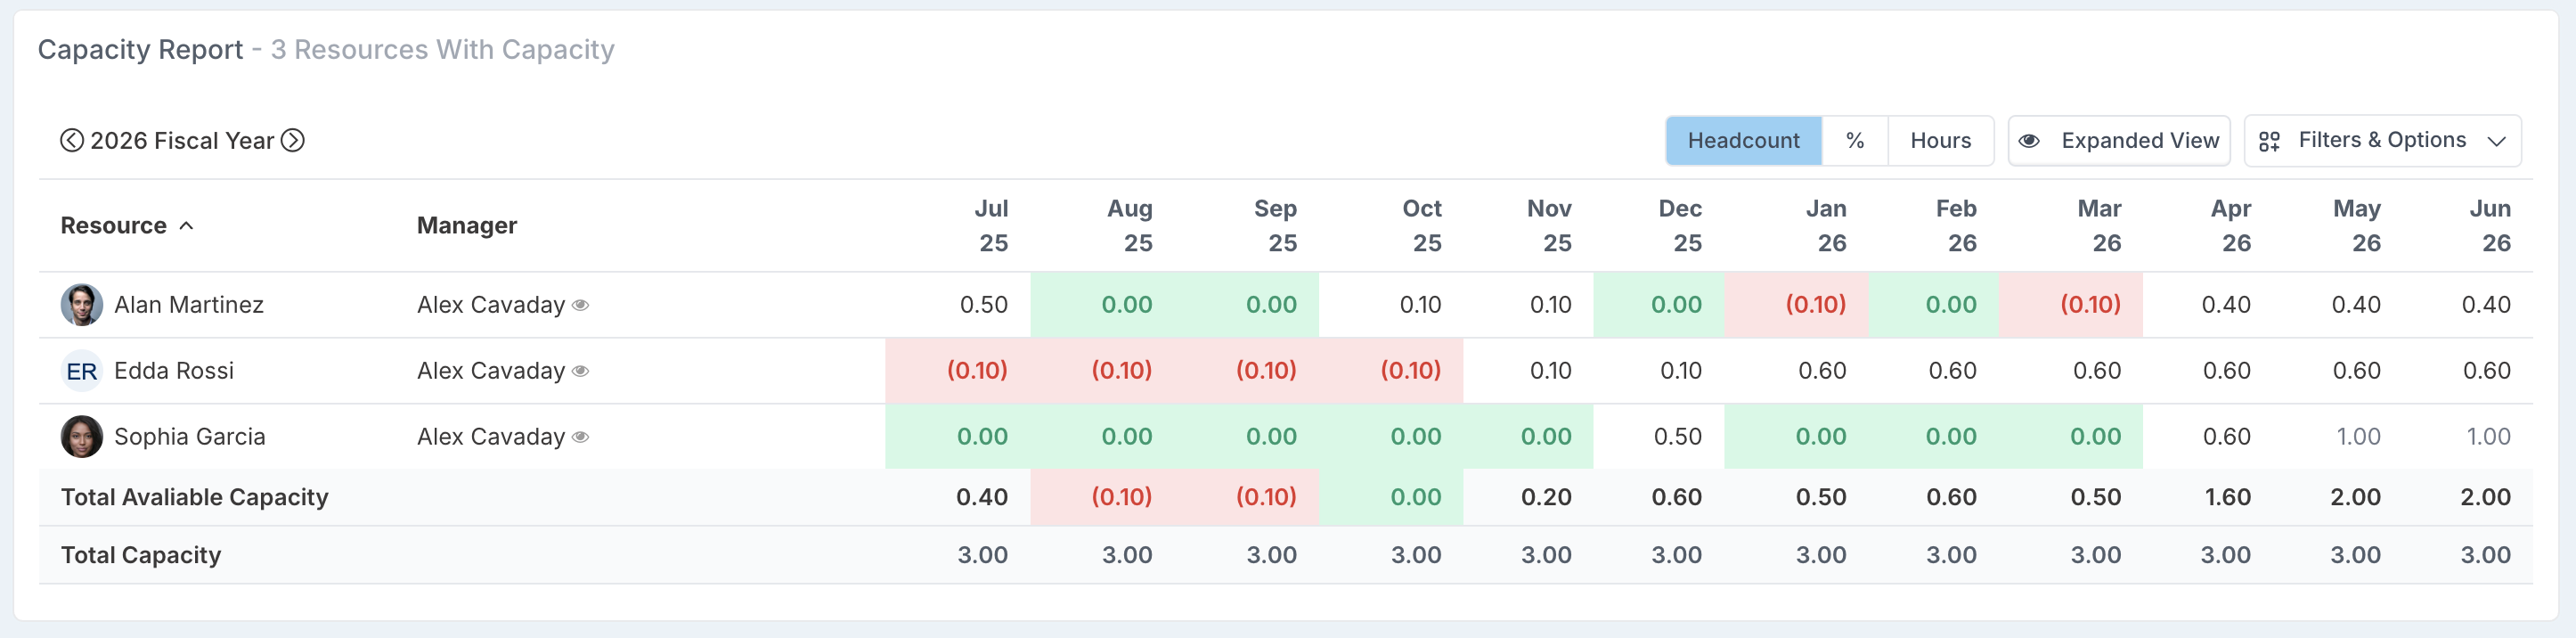
Rather than focusing on what’s been allocated, this view highlights how much capacity is still available for each resource. It’s especially useful for forward planning, identifying under-utilised team members, and balancing workloads.
Capacity Highlighting:
Red background: the resource is overbooked (i.e. they have negative remaining capacity).
Green background: the resource is fully utilised (i.e. no spare capacity).
No background: capacity is available.
Views by Headcount, % and Hours: As with the allocation dashboard, you can view capacity in the unit that best fits your planning style - headcount, percentage, or hours.
Grouping and Filtering: You can group resources by Delivery Team, Role, Engagement Type, Country, Region and other dimensions, enabling more meaningful reporting and comparisons across different parts of the organisation.
Expanded View – Project Breakdown: Just like the allocation report, you can switch to Expanded View to see how each resource’s allocations are distributed across their assigned projects, offering deeper insight into what’s driving remaining capacity.
This dashboard gives Delivery Teams and PMOs a forward-looking view of resource availability, helping to surface risks of over-utilisation and plan upcoming work with confidence.
Accessing the Resource Dashboards
To access these dashboards, go to Other Dashboards and select the Resource Dashboards tab.
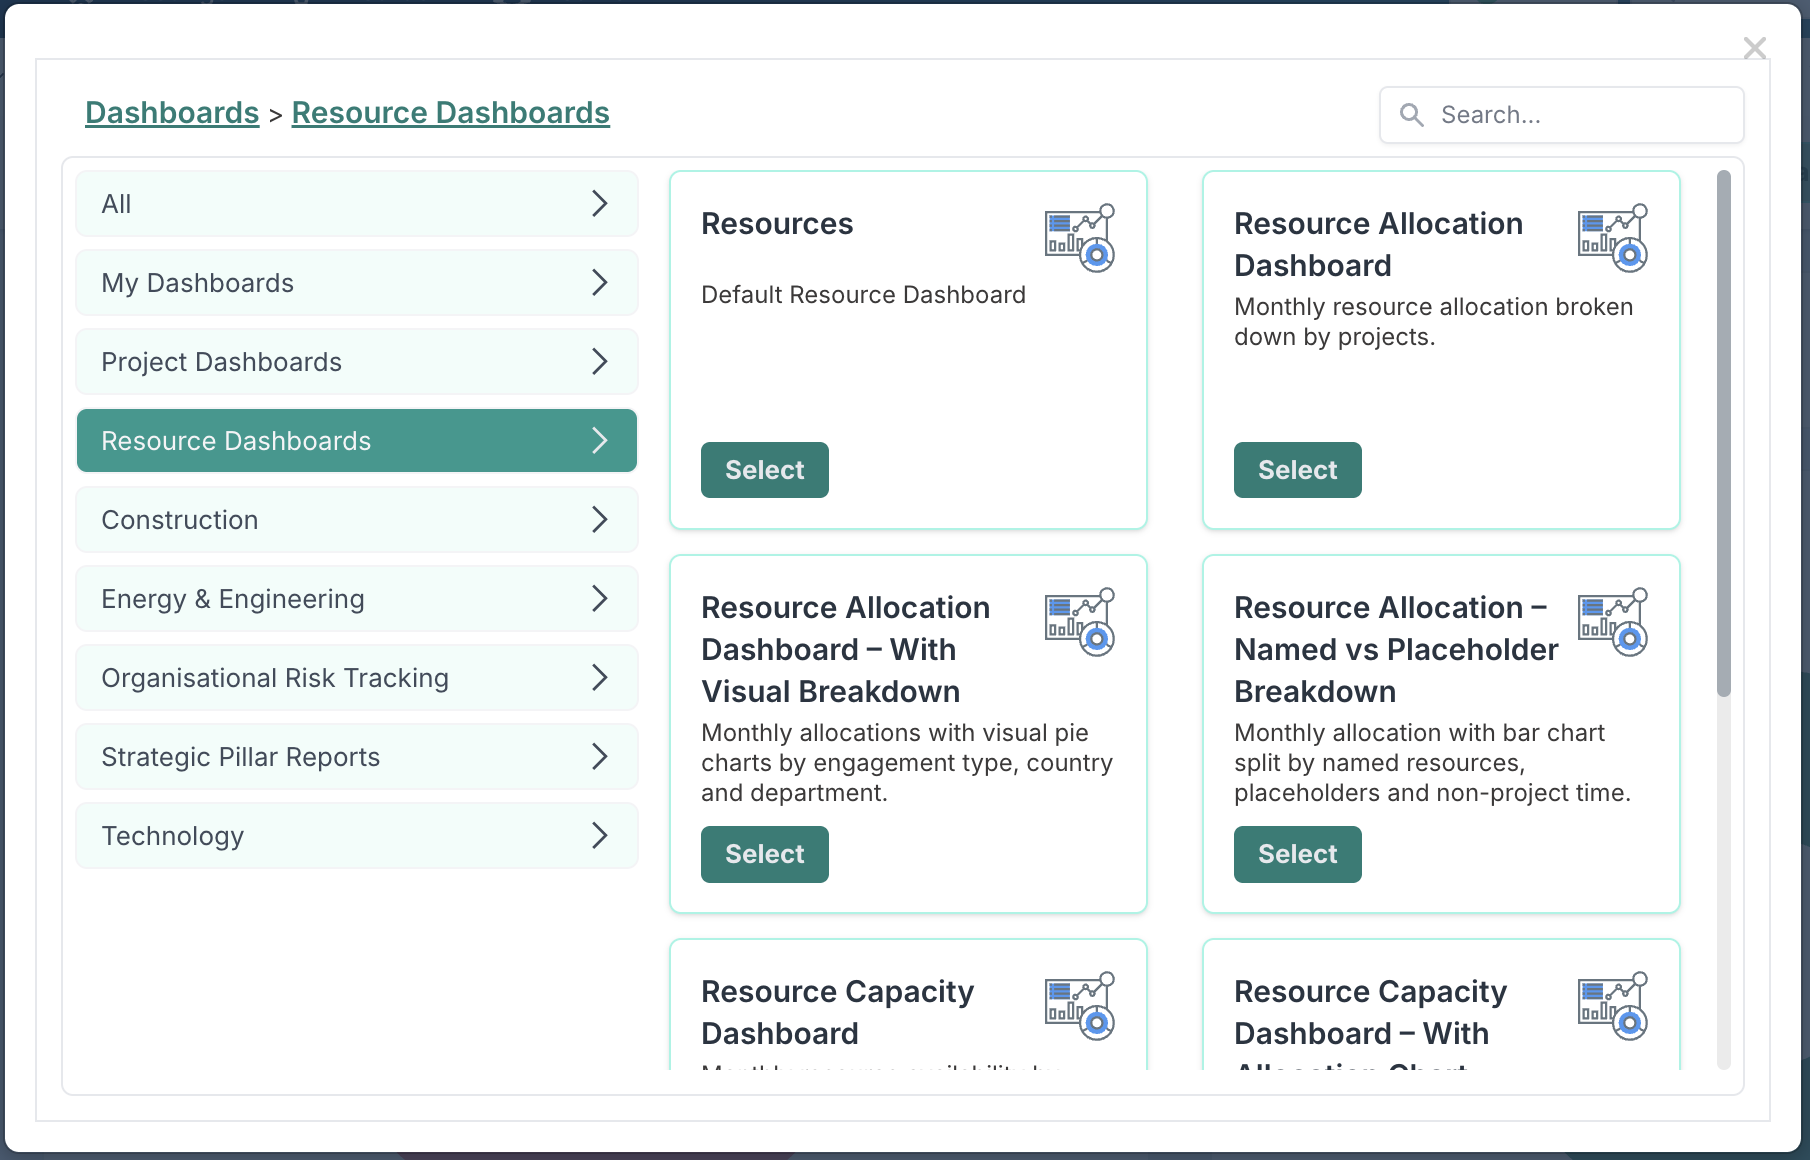
From there, you’ll find the following options to suit different planning and reporting needs:
Resource Allocation Dashboard
View monthly resource allocations, with the option to switch to Expanded View for a project-level breakdown.Resource Allocation Dashboard – With Visual Breakdown
See monthly allocations alongside visual pie charts summarising effort by engagement type, country, and department.Resource Allocation – Named vs Placeholder Breakdown
Understand how much time is allocated to named resources, placeholders, and non-project time using a bar chart format.Resource Capacity Dashboard
Track monthly availability by comparing forecast allocations against capacity. Highlights under- and over-utilised resources.Resource Capacity Dashboard – With Allocation Chart
Combines grid and bar chart views to visualise monthly capacity vs allocation, helping spot utilisation trends at a glance.
Enhancements and Fixes
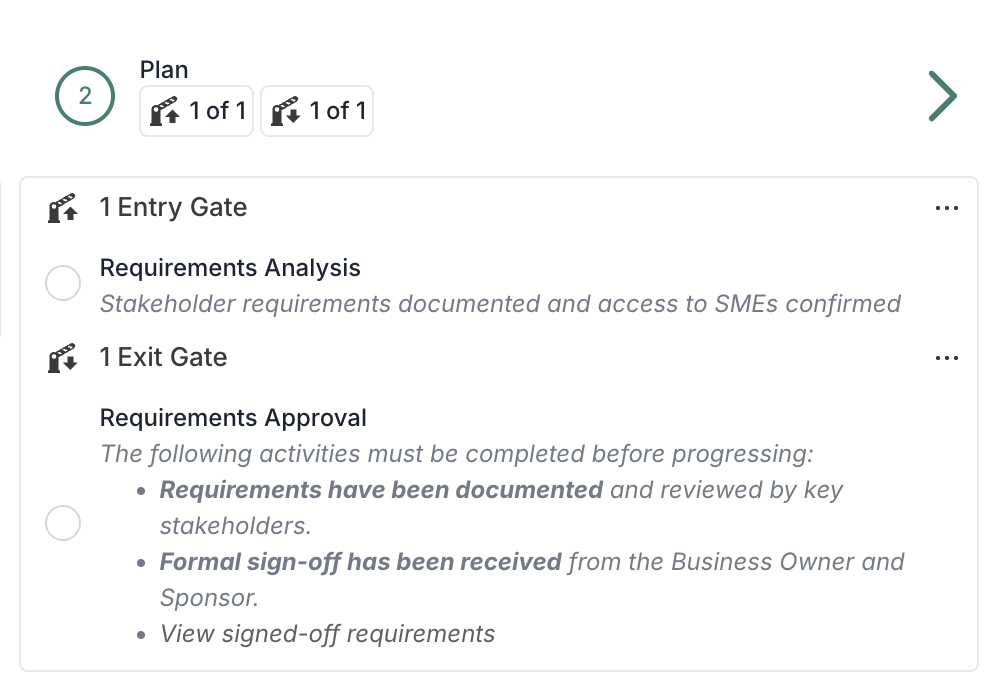
Stage Gates – Rich Text Descriptions: You can now use rich text and insert hyperlinks in stage gate descriptions, allowing for clearer guidance and more accessible supporting information.
Process Boards - Subtasks via Drag & Drop: You can now add existing tasks as subtasks to a parent task using drag and drop. Simply group the board by 'Parent', then drag the task into the relevant parent grouping. (To create new subtasks, use the Follow On section in the board task dialog.)
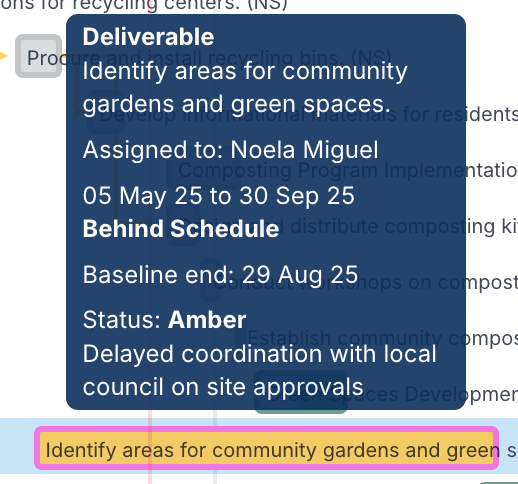
Project Schedule: A new hover popover in the schedule view displays key task details at a glance, including task type, title, start and end dates, assignees, baseline end date, RAG status, and strapline.
Project Pipeline Board: Fixed an issue where the Tier value was not correctly carried over when creating a project from a pipeline card, particularly when the Tier field had been renamed.
Resource Forecast Bulk Edit: Added a new column to display the resource name alongside the reference, making it easier to identify each resource when editing forecasts in bulk.
Fluid API: Fixed permission-related issues when accessing Actions and Boards via the v3 REST API.
Atlassian JIRA Integration: Resolved an error when querying issues that include fields using multi-option string values.
Process Board Notifications: Fixed an issue where notifications triggered by moving a card to another column incorrectly showed the card creator's name instead of the user who moved the card.
5th June Patch Release
Enhancements and Fixes
Gantt Schedule: The horizontal scrollbar is now always visible, improving usability when navigating across the timeline.
Meeting Minutes PDF: Fixed a layout issue where meeting minutes PDFs were not rendering correctly.
Delivery Team Workspaces: Actions and decisions from private boards or meetings are no longer displayed in delivery team workspaces, ensuring confidentiality.
Resource Dashboards – Delivery Team Filter: When filtering by delivery team, the URL now retains the delivery team reference after page reloads, maintaining the selected filter.
Project Workspace – Impact Filter: Improved the positioning of the Impact filter menu to ensure it is fully visible and accessible.
Avatar Initials: Enhanced support for generating initials in avatars when names include special characters like "&" — for example, "Finance & Legal" will now appear as "FL".
4th June Patch Release
Enhancements and Fixes
Timesheet Reminders: Timesheet reminders will now be sent to resources regardless of their email notification preferences, ensuring timely submission.
Program Workspace – Community Grid: Added a Community Grid to the Program workspace, enabling visibility of resource allocations by project within the program. This complements the existing chart view, which shows monthly total allocations across the program.
2nd June Patch Release
Enhancements and Fixes
Stage Gate Approval Fix: Resolved an issue where decision approvals were still triggered even after the approver had been removed from the stage gate definition. This caused decisions to be created without an assignee.
Gantt View Update: Upgraded DHTMLX library to address indenting issues when editing tasks in the Gantt view.