
August 2025 Release Notes
28th August Release (v. 16.0.31215)
Resource Dashboards: Group by Project Attributes
Until now, the Resource dashboards could only be grouped using resource attributes such as skill, role, region, or team. This meant that when reviewing capacity and demand, PMOs and portfolio managers could only look at resourcing from the perspective of who the people are rather than what projects they are working on.
With this release, you can now group resources by project attributes – starting with Project Portfolio, Sub-Portfolio, Project Type, Projects and Project Status. This gives you a much clearer picture of resourcing across projects and helps you answer questions such as:
Who is allocated to projects in this portfolio or sub-portfolio?
How much capacity is tied up in projects of a particular type?
How much effort is going into projects at a given status?
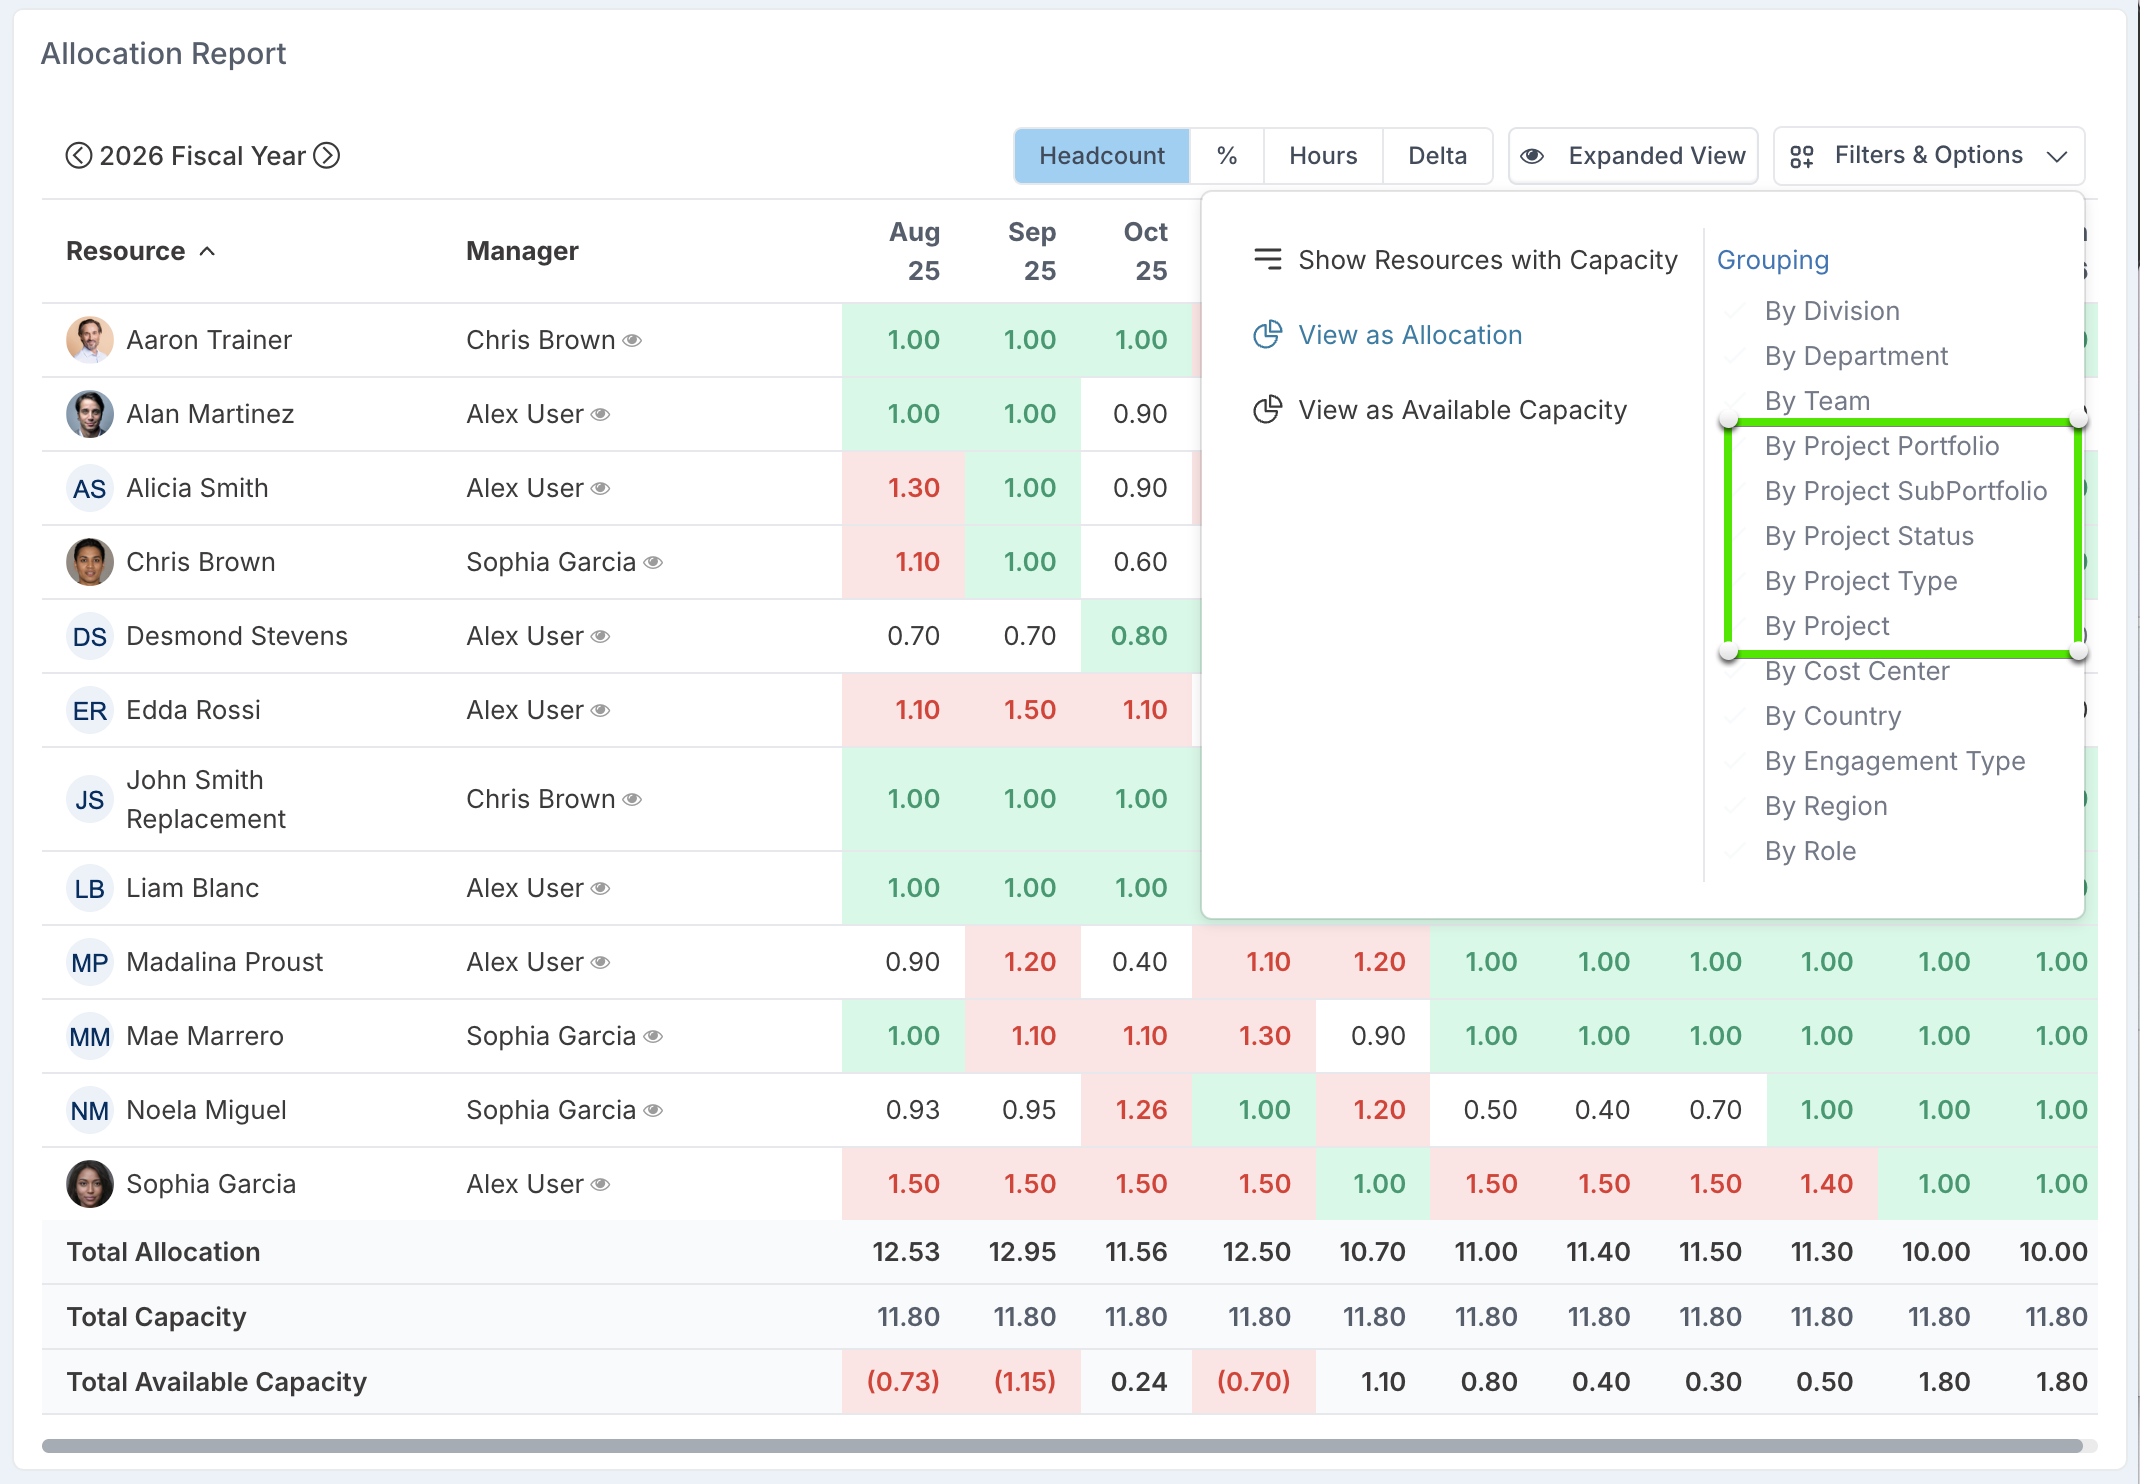
Once you have grouped by a project attribute, the dashboard offers two ways of viewing allocations.
By default, the view is focused: you will see the resources allocated to projects that match your selected grouping, and their allocations are shown only for those projects.
If you need visibility of where else those resources are working, you can switch on the 'Show All Allocated Projects' toggle.
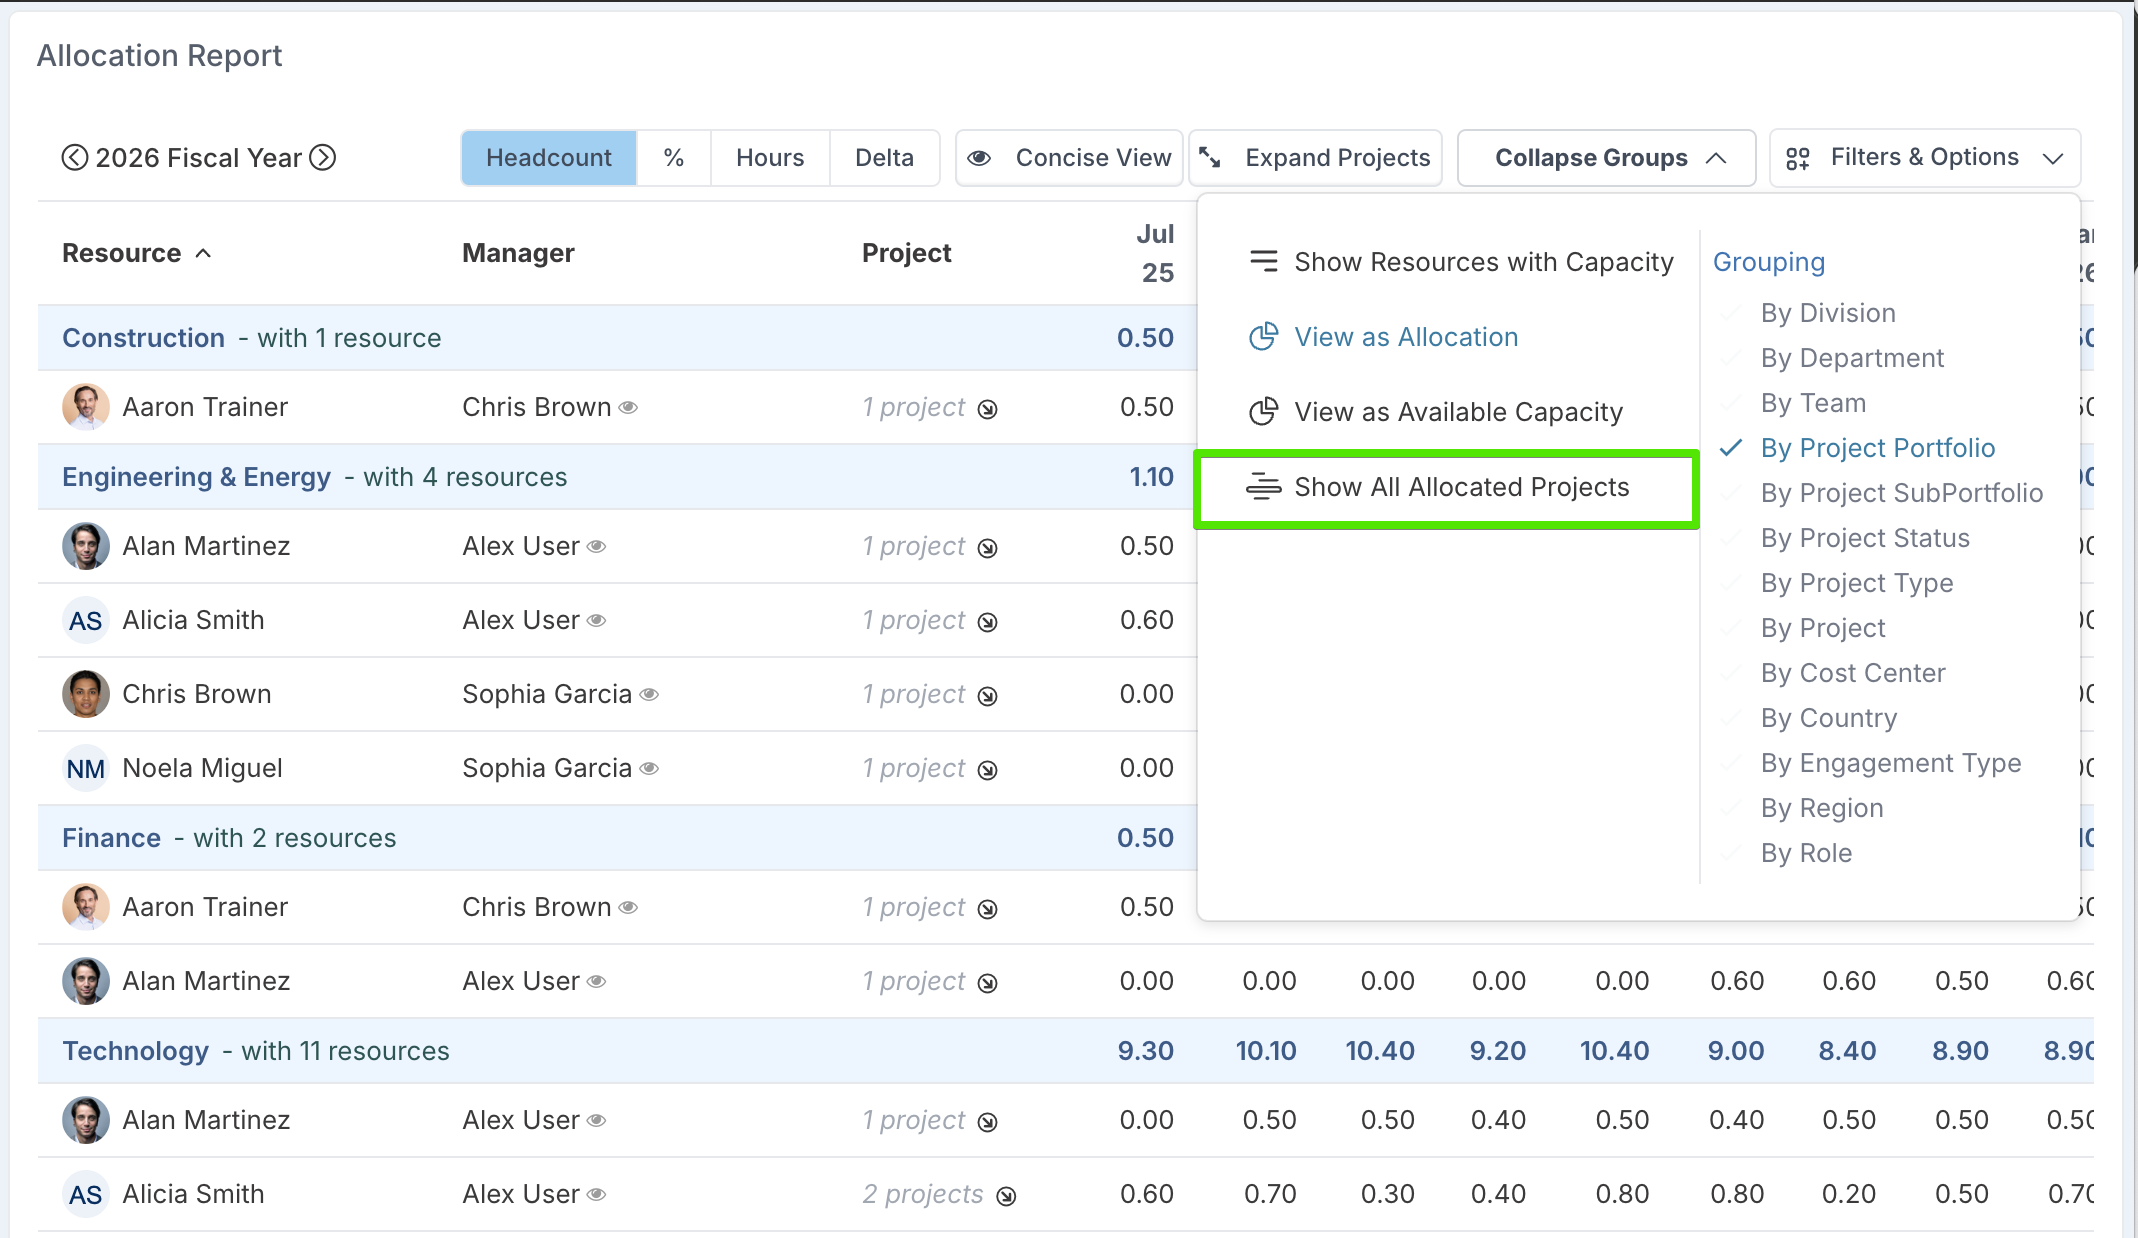
The resources remain listed under the same grouping, but their allocations to other projects are also displayed. This gives you both the context of the selected grouping and a complete picture of competing demand across all their projects.
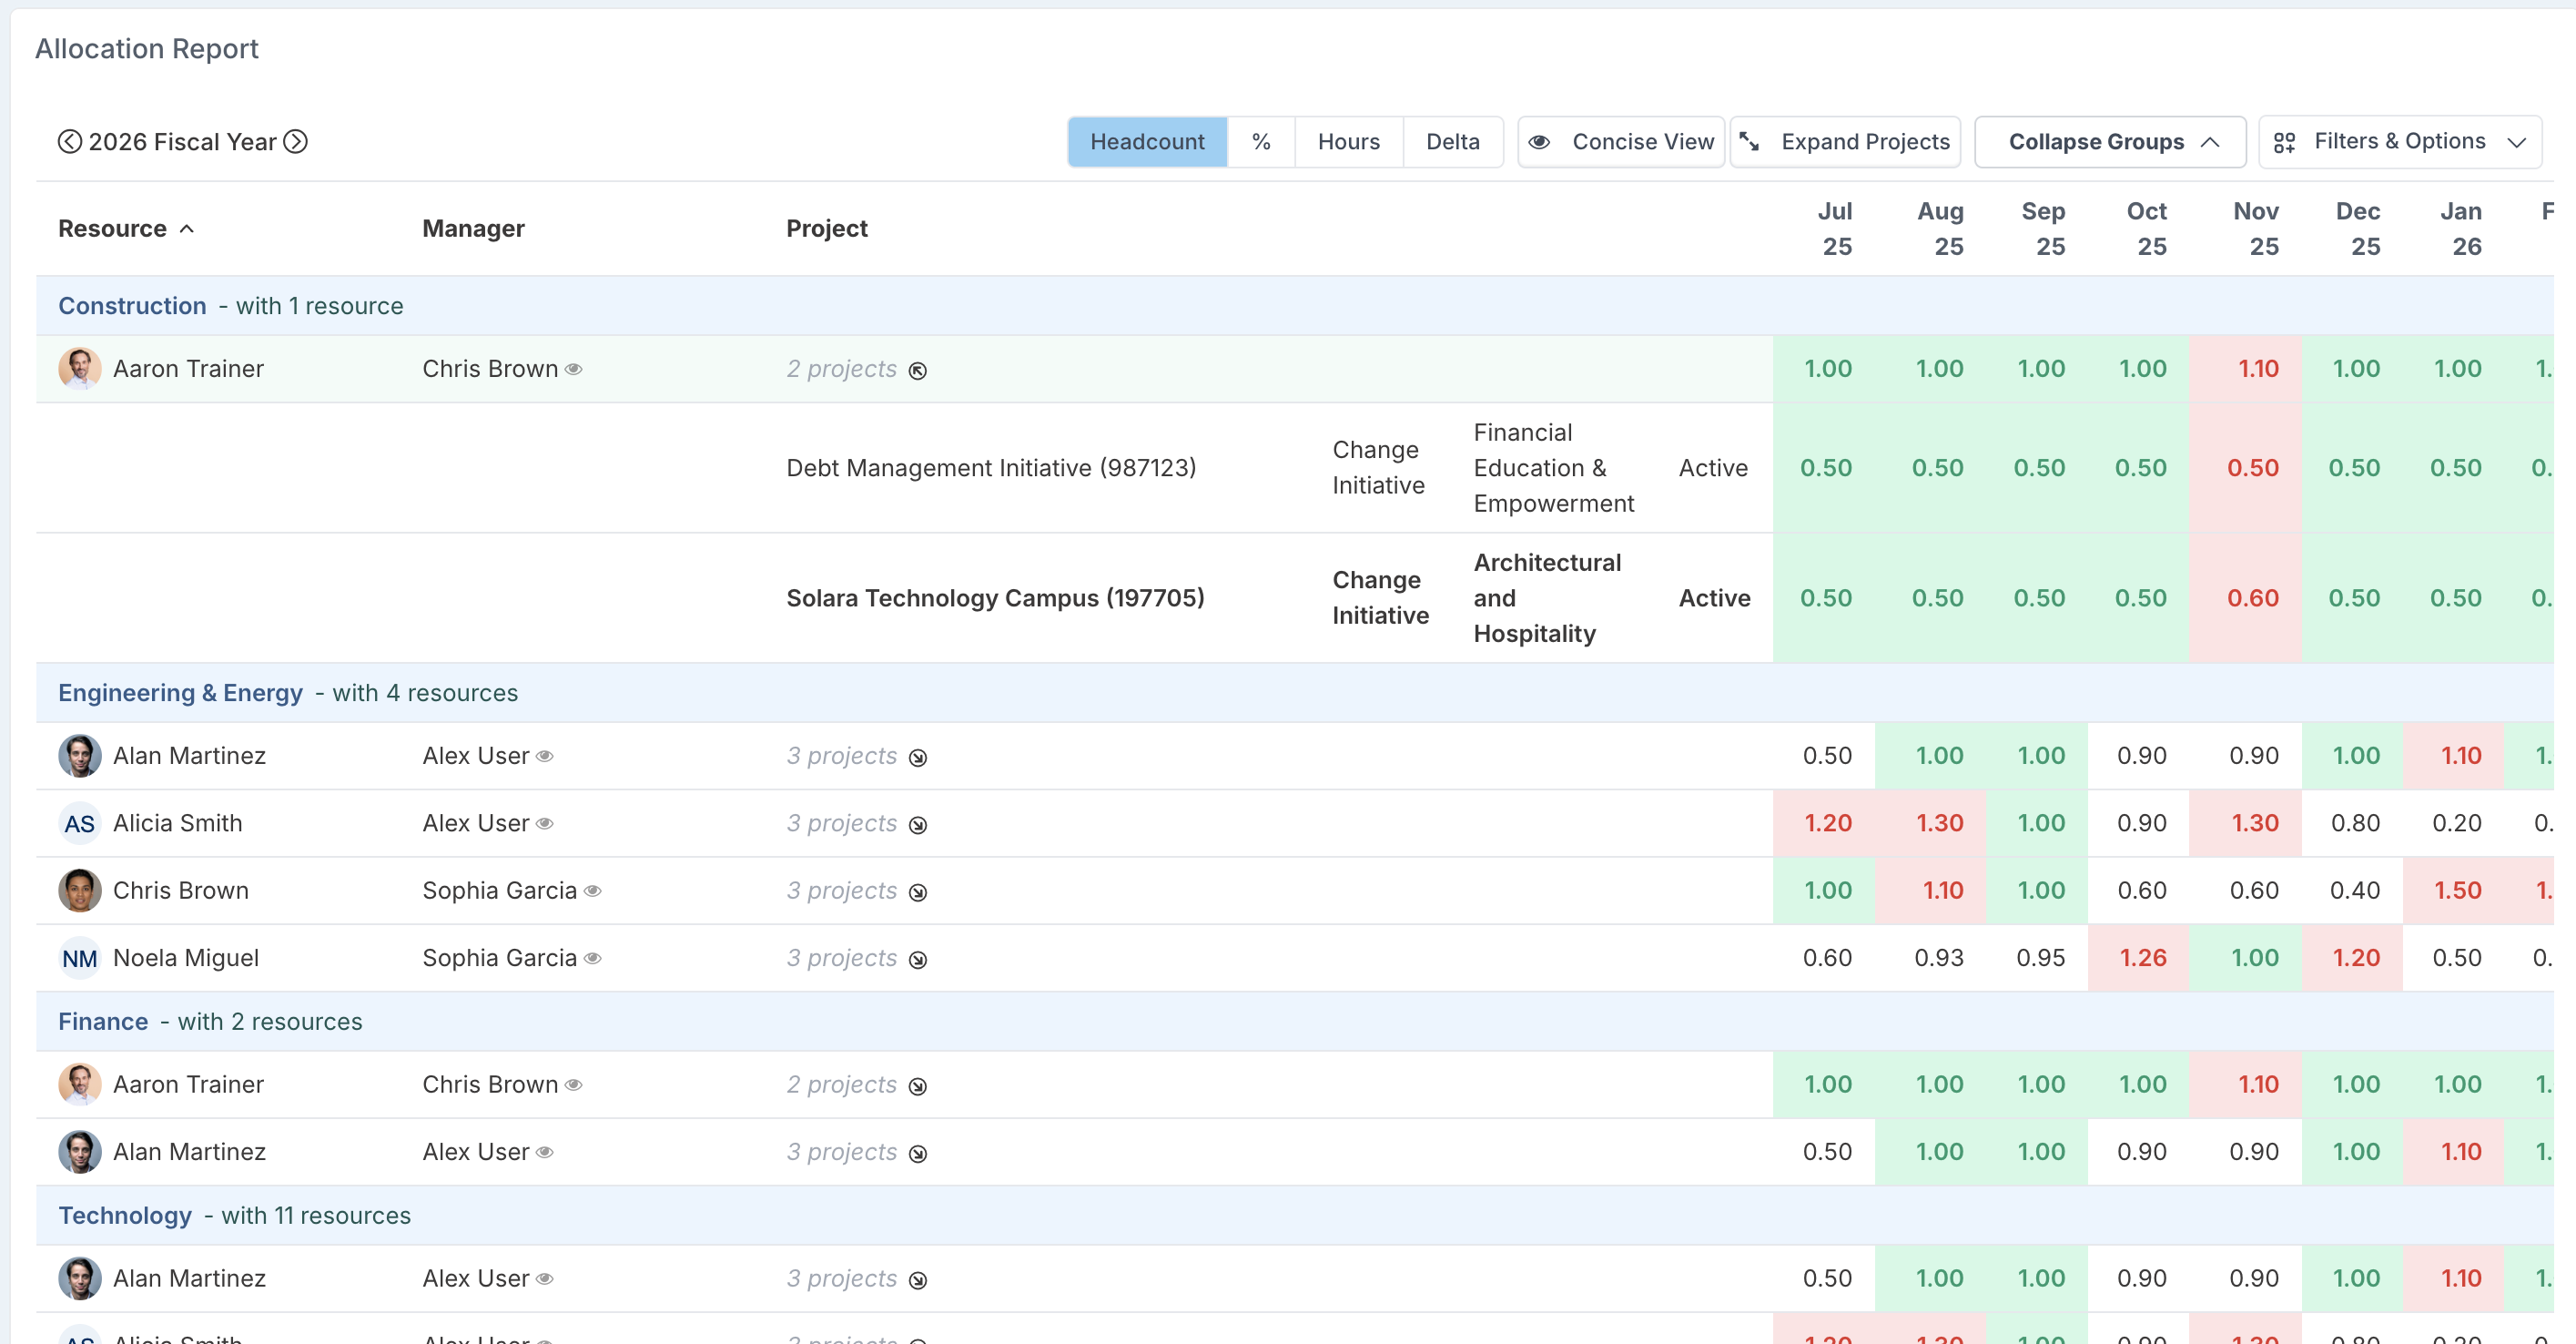
Please note that in this expanded view, the projects that match the grouping are highlighted in bold, making it easy to distinguish them from the additional projects shown.
New report - Resource Capacity vs Project Demand
We’ve introduced a new report that makes it easier to compare how resources are being used against the capacity they have available.
The Resource Capacity vs Project Demand report shows each resource’s current capacity alongside their monthly project allocations. This gives PMOs and portfolio managers a clear view of whether resources are under- or over-allocated, helping to identify where adjustments may be needed.
Capacity in the report reflects the resource’s present availability, which means it may differ from their historical capacity values. Allocations are calculated according to the reporting period:
Locked months display allocations based on actuals.
Open months display allocations based on forecasts.
This report provides a practical way to:
Highlight resources who are consistently over-committed.
Spot under-utilised capacity that can be redirected.
Support capacity planning discussions with real data on actual vs forecast usage.
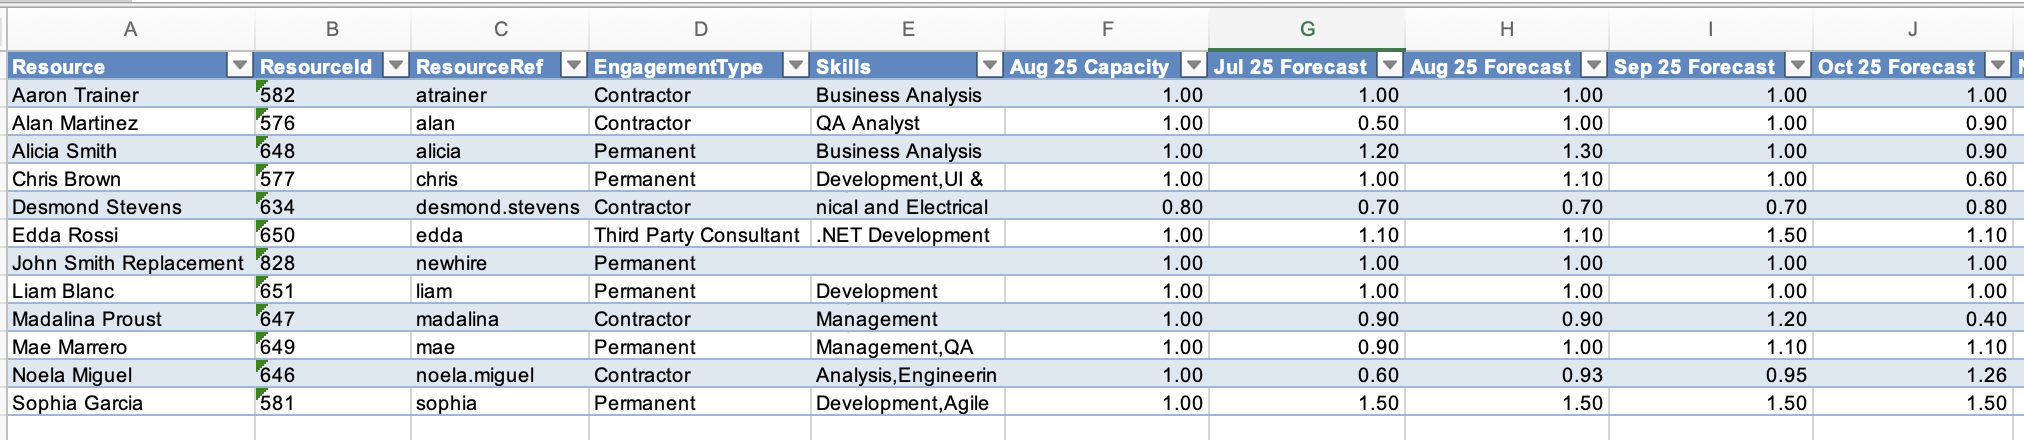
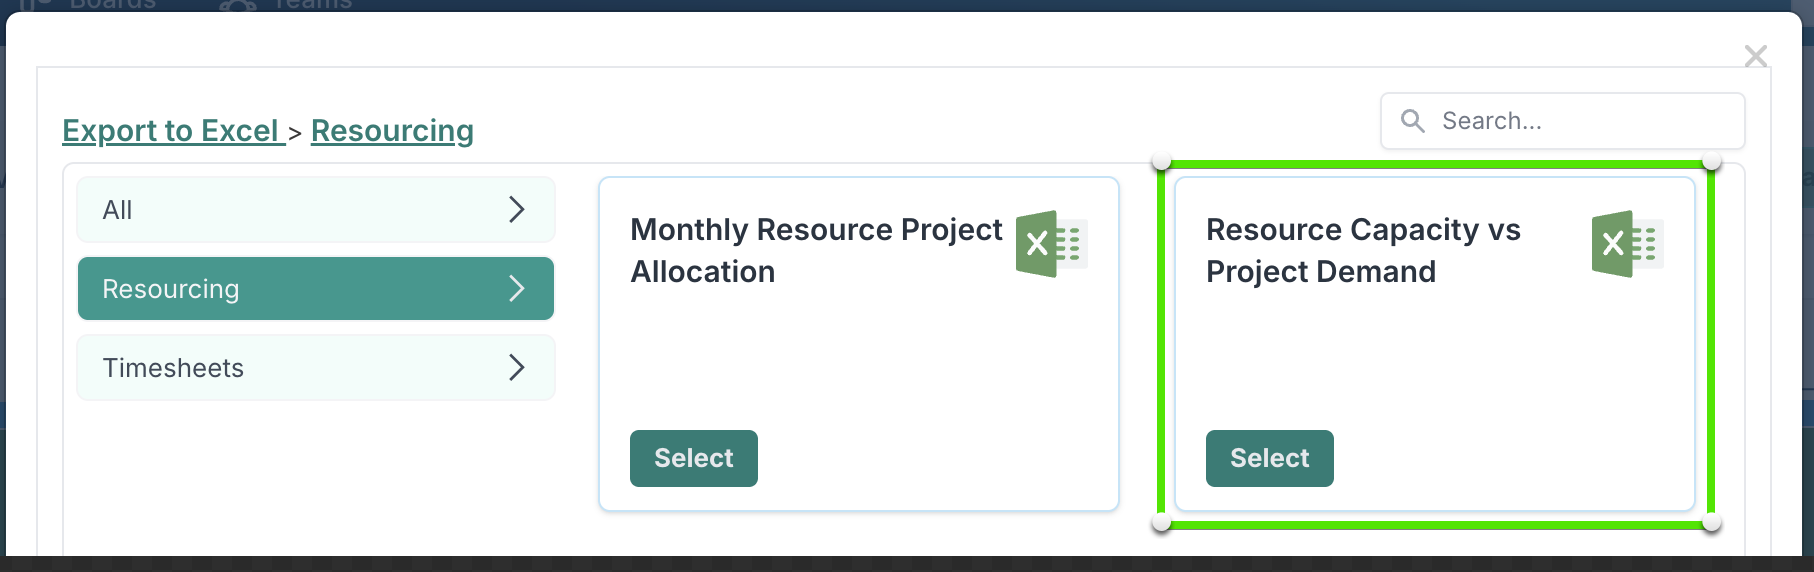
You can access this new report from the Resource dashboards. Open the Tools menu and select 'Export to Excel'. Under the Resourcing tab, choose 'Resource Capacity vs Project Demand'.
New - Forecast Only Rate Cards
We’ve introduced a new configuration option for rate cards. Until now, rate cards were always applied to generate both:
Forecast costs – from resource allocations
Actual costs – from submitted timesheets
This was a limitation for PMOs who wanted to use Fluid to forecast resource costs and track time through timesheets, while still relying on an external system (e.g. a GL system or contractor invoicing platform) for actual cost reporting.
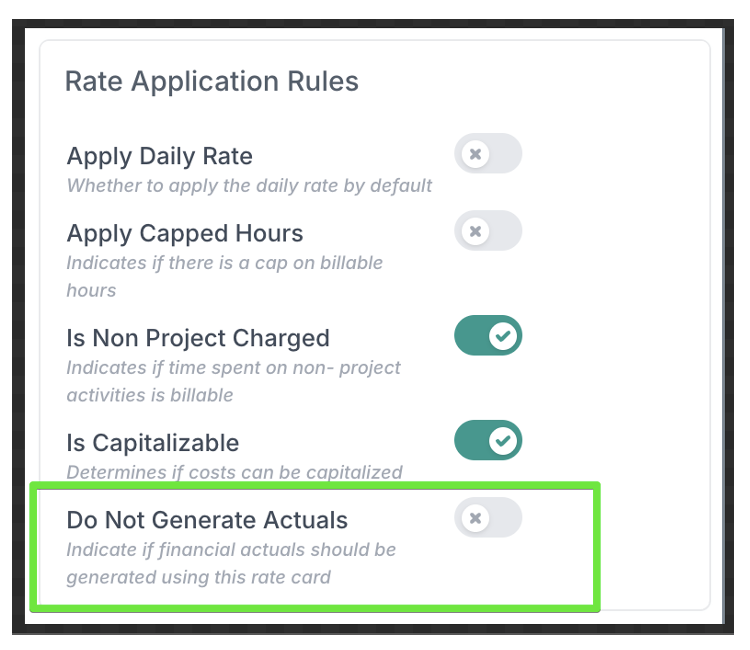
With this update, financial administrators can now configure a rate card to generate forecast costs only. In the rate card setup, set the toggle Do Not Generate Actuals to Yes to use the rate card solely for calculating forecast costs. Once enabled, timesheets submitted by resources on this rate card will not generate actual cost records.
New - Schedule Sub-Types for Better Classification
Schedule Sub-Types provide an additional level of classification for schedule items. While the primary type gives you the broad category (e.g. Milestone, Phase, Deliverable), a sub-type allows you to specify the kind of item it is. For example, a milestone could be a Design Sign-off, Regulatory Approval, or Go-Live.
This makes it easier for stakeholders to understand the nature of schedule items at a glance, without needing to read full task descriptions.
With Sub-Types, you can:
Filter reports to show only certain types across the portfolio (e.g. all Go-Live milestones).
Analyse trends by sub-type, such as performance or slippage patterns (e.g. Regulatory Approvals tend to run 15% late).
Build dashboards that track specific deliverable categories for greater visibility.
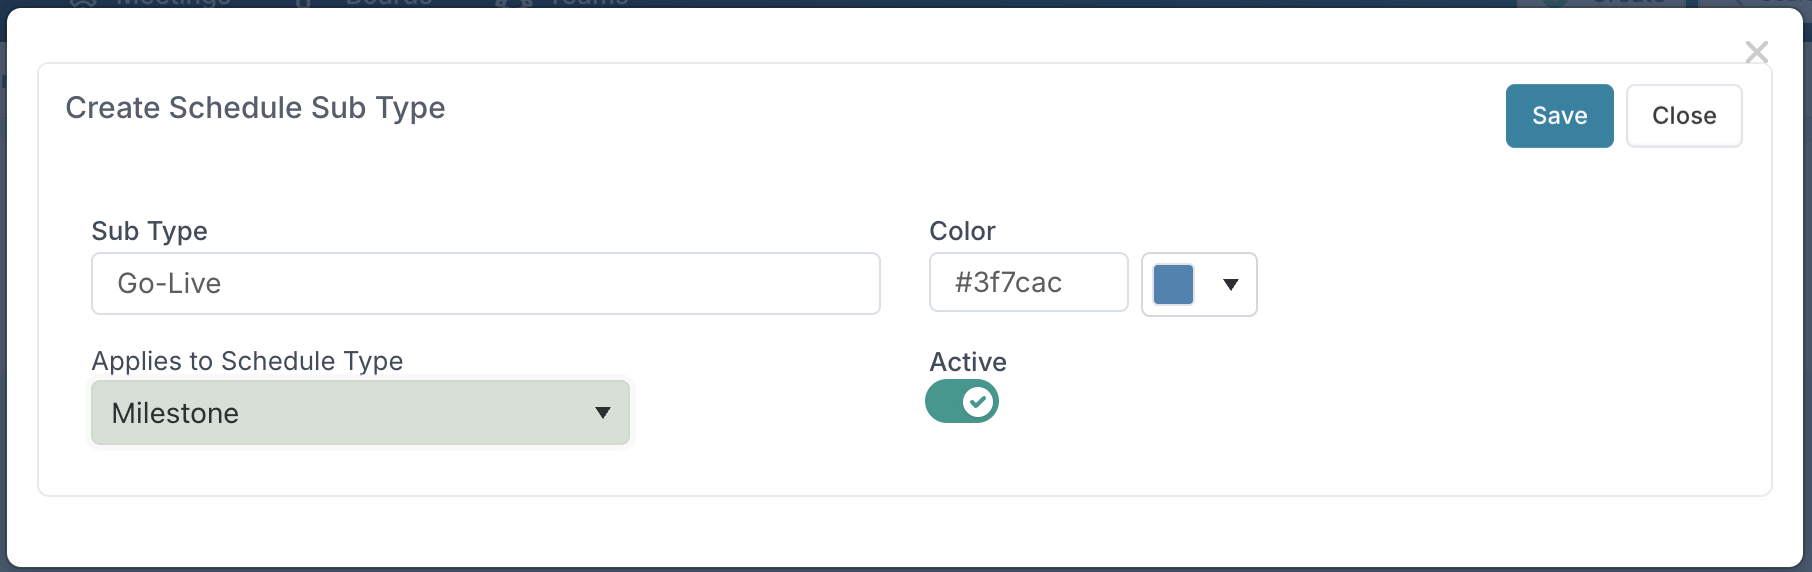
Sub-Types are created and maintained by the application administrator. From the Metadata page, select Schedule Sub-Type to add or edit entries.
Configuration options:
Name – the label that appears in schedules and reports.
Colour – used to visually highlight tasks with this sub-type in Gantt and schedule views.
Applies to – define whether the sub-type is available for all schedule types (Milestone, Phase, Deliverable, Workstream, Action) or restricted to a specific type (e.g. Go-Live only applies to milestones).
Once set up, project managers can assign sub-types when creating or editing schedule tasks.
The Type field is always mandatory; Sub-Type is optional.
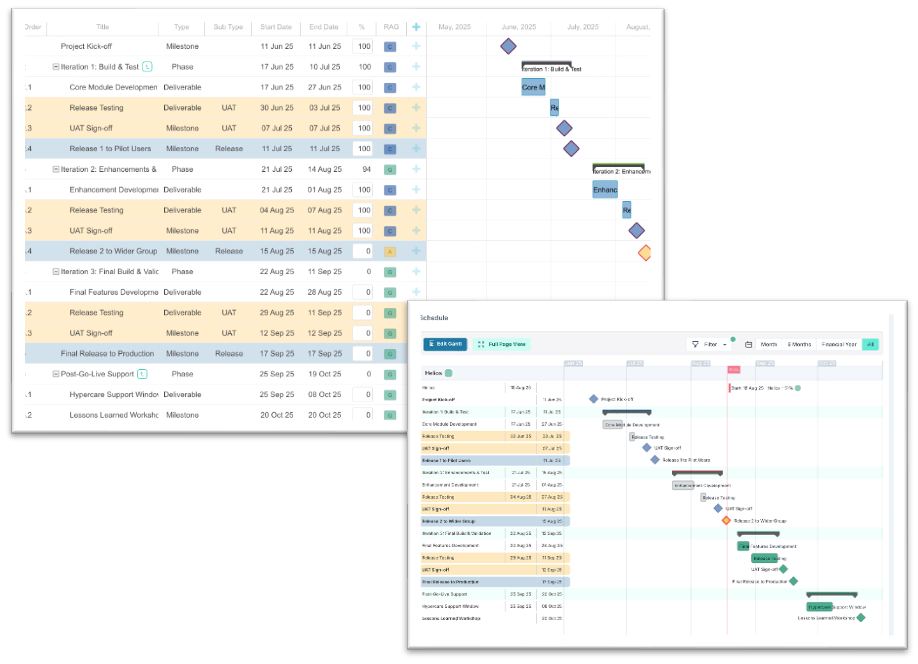
Tasks assigned a sub-type will be displayed in the colour associated with that sub-type, making them easy to spot in timelines and reports.
Enhancements
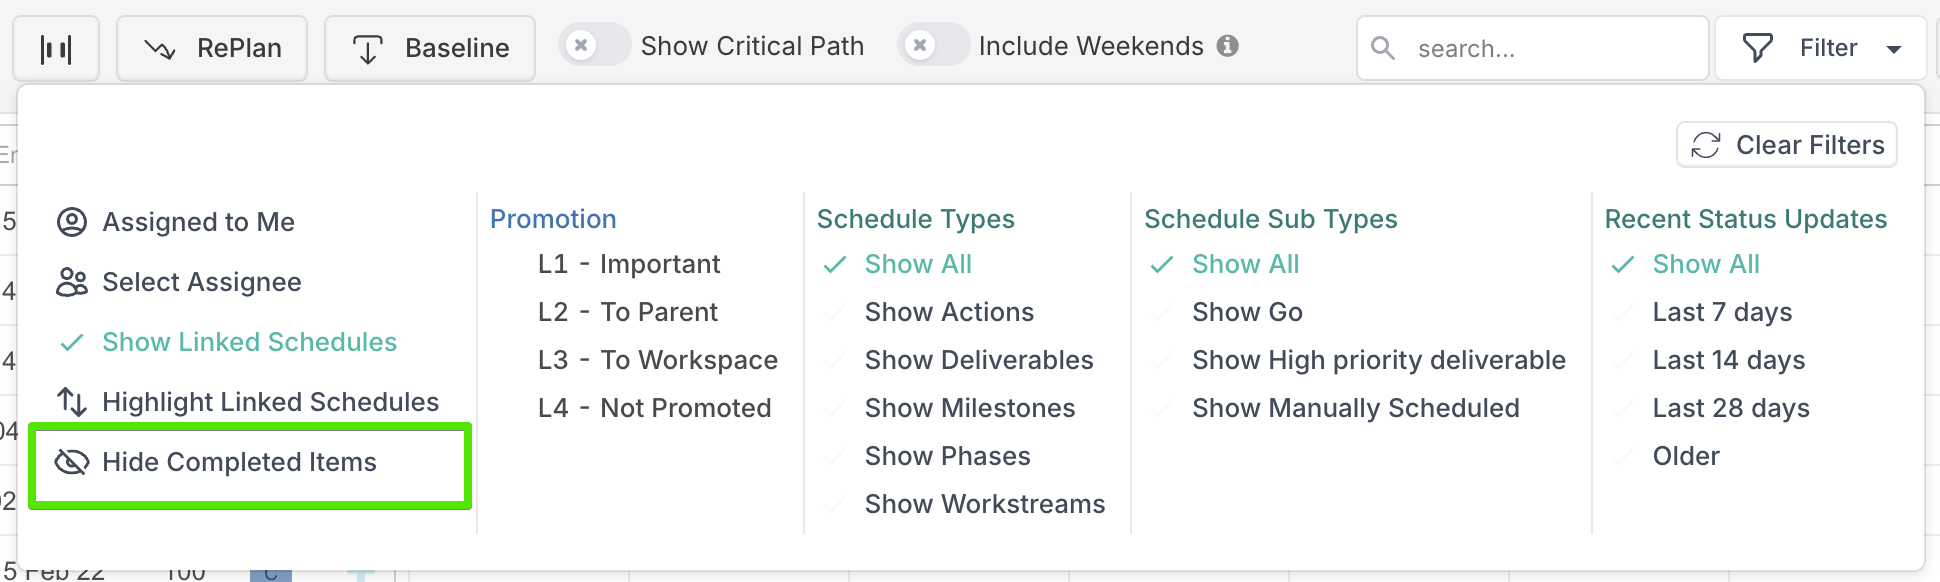
Gantt Schedule View: Added a filter option to hide completed tasks. This is especially valuable for projects with long and complex schedules, where reviews typically focus on what lies ahead rather than what has already been delivered.
Impacts: When an impact is closed, a status update with the status Complete is now automatically added.
MS Project Plan Upload: Phases and milestones now default to promotion level L1, with all other tasks defaulting to L4. This ensures that key information (phases and milestones) is surfaced in the project workspace and dashboards by default, while detailed execution tasks remain available in the Edit Gantt View or by using the filters in the Schedule View and Full Page View.
24th August Patch Release (v. 15.4.31092)
Fixes:
Board Cards: Corrected the colour pill styling for subtasks in the edit dialog when board cards are linked to DevOps.
Baseline Financial Upload: Made the Expense Category / Type validation check case-insensitive.
Revenue Upload: Fixed an issue that caused revenue upload files to fail.
19th August Patch Release (v. 15.4.31013)
Fixes:
Impacts: Removed the Mitigation field when logging decisions.
Portfolio & Subportfolio Bulk Edit: Fixed an issue where updates triggered permissions jobs for each project, causing performance problems.
Financials Grid: Corrected a column layout issue where columns were offset when the Capex/Opex split was not enabled.
14th August Patch Release (v. 15.4.30915)
Enhancements & Fixes:
Project Detail Export to Excel: Added a Current Phase column to the Project Details export to indicate the project's current phase.
Schedule Bulk Edit: Fixed an issue where using bulk edit from a program or parent project to update a sub-project’s schedule was incorrectly changing the order of tasks.
Project Governance Export to Excel: Resolved an error that occurred when exporting if the project did not have any assessment scores to report.
Scenario Planning:
Improved the overall user experience when performing scenario planning.
Enabled project administrators to create scenarios directly from a project dashboard. When a scenario is created this way, all projects included in the dashboard are automatically included in the scenario.
8th August Patch Release (v. 15.4.30806)
Fixes:
PDF – Schedule Full View: When printing the full schedule view to PDF, filter selections were not being respected. The output now correctly reflects the applied filters.
Project Details Bulk Edit: Uploading a project that was already archived incorrectly reset its status to active, even when the uploaded file still showed the status as archived.
POWER BI Data Refresh Requests: To ensure platform stability and responsiveness for all users, limits have been introduced on how often Power BI data refreshes can be requested.
For FDE report types, each user can request a data refresh only once per hour.
For non-FDE report types, each user can request a data refresh once every 10 minutes.
7th August Patch Release (v. 15.4.30769)
Fixes:
Project Dashboards: Fixed an issue where filters applied to the Impact Grid were not saved correctly when saving the dashboard. As a result, the dashboard did not render the expected filtered view.
Board Tasks: Deleting an attachment from the board task dialog did not refresh the view, and the attachment continued to appear until the dialog was closed and reopened. This has now been resolved.
Project Dashboards: Fixed an error that was preventing saved dashboards from being deleted.
Schedule View: Resolved a date alignment issue where the schedule tasks were not aligned to the correct month in certain scenarios.
5th August Patch Release
Fixes
Timesheet Corrections: Timekeepers could not submit corrections if the resource allocation to the project they were trying to submit time to included a financial reference.
4th August Release (v. 15.4.30628)
Track Start and End Dates on Board Tasks
We’ve introduced Start Dates to board tasks, giving delivery teams, project managers, and PMOs greater visibility into when work is planned to begin and not just when it’s due.
Previously, tasks on boards could only be assigned a due date. While this was sufficient for simple tracking, it limited the ability to understand when work actually starts and how long it's expected to run. With this enhancement:
Teams can now capture both the start and end of a task.
The start date gives a better indication of expected commencement, especially when tasks span multiple days or are dependent on other work.
Tasks can be more accurately sequenced and prioritised within a board.
This change is particularly valuable for teams using Fluid boards to manage Agile delivery, as it brings more structured planning to daily task execution, while maintaining the flexibility of a Kanban-style approach.
Getting Started
To enable start dates on a board:
Open the board you want to update.
Go to the Board Settings page.
Enable the Enable Start Date for Board Cards toggle.
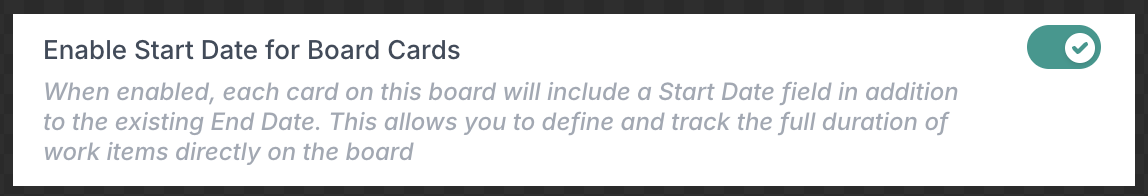
Once enabled, all board tasks will include a Start Date field alongside the Due Date. Start dates can be entered manually or updated via integrations (e.g. DevOps or Jira) if configured.
Bridging Agile and Traditional Scheduling: Link Schedule Tasks to Board Tasks
This release introduces a powerful enhancement that brings Agile flexibility and traditional scheduling together in one seamless experience. Project managers and PMOs can now link any type of schedule task - whether it's a milestone, deliverable, workstream, action, or phase - directly to tasks on their boards.
This is made possible by the addition of start dates on board tasks, introduced as part of this release. With both a start and end date available on board tasks, schedule items that span a duration - such as deliverables, phases, and workstreams - can now be driven by the timelines defined at task level.
Whether you're using DevOps, Jira, or Fluid’s own Kanban boards, this feature enables your schedules to reflect what’s really happening across your delivery teams. It eliminates the need for manual updates and gives project managers and PMOs a real-time view of progress across the schedule.
For example, if you're using DevOps, you can first link your Fluid board to your DevOps project. Once that connection is established, you can then link your schedule tasks in Fluid to the tasks on your Fluid board. As developers update the status of their tasks in DevOps, those updates flow through the Fluid board and are reflected in your schedule. This ensures that the start and end dates, progress, and completion status of tasks are always up to date, giving you a synchronised plan with minimal effort.
For those using Fluid’s own boards without any external integration, the process is just as smooth. You can link your schedule tasks directly to tasks on your Fluid board. As your team progresses through their Kanban workflow, those updates are reflected in your schedule.
How Linking Works
Project managers continue to use the existing Link a Board Task action to link schedule tasks to board tasks.
You can now link a board task to any type of schedule item, not just milestones. This includes:
Phases
Deliverables
Workstreams
Actions
Milestones (as before)
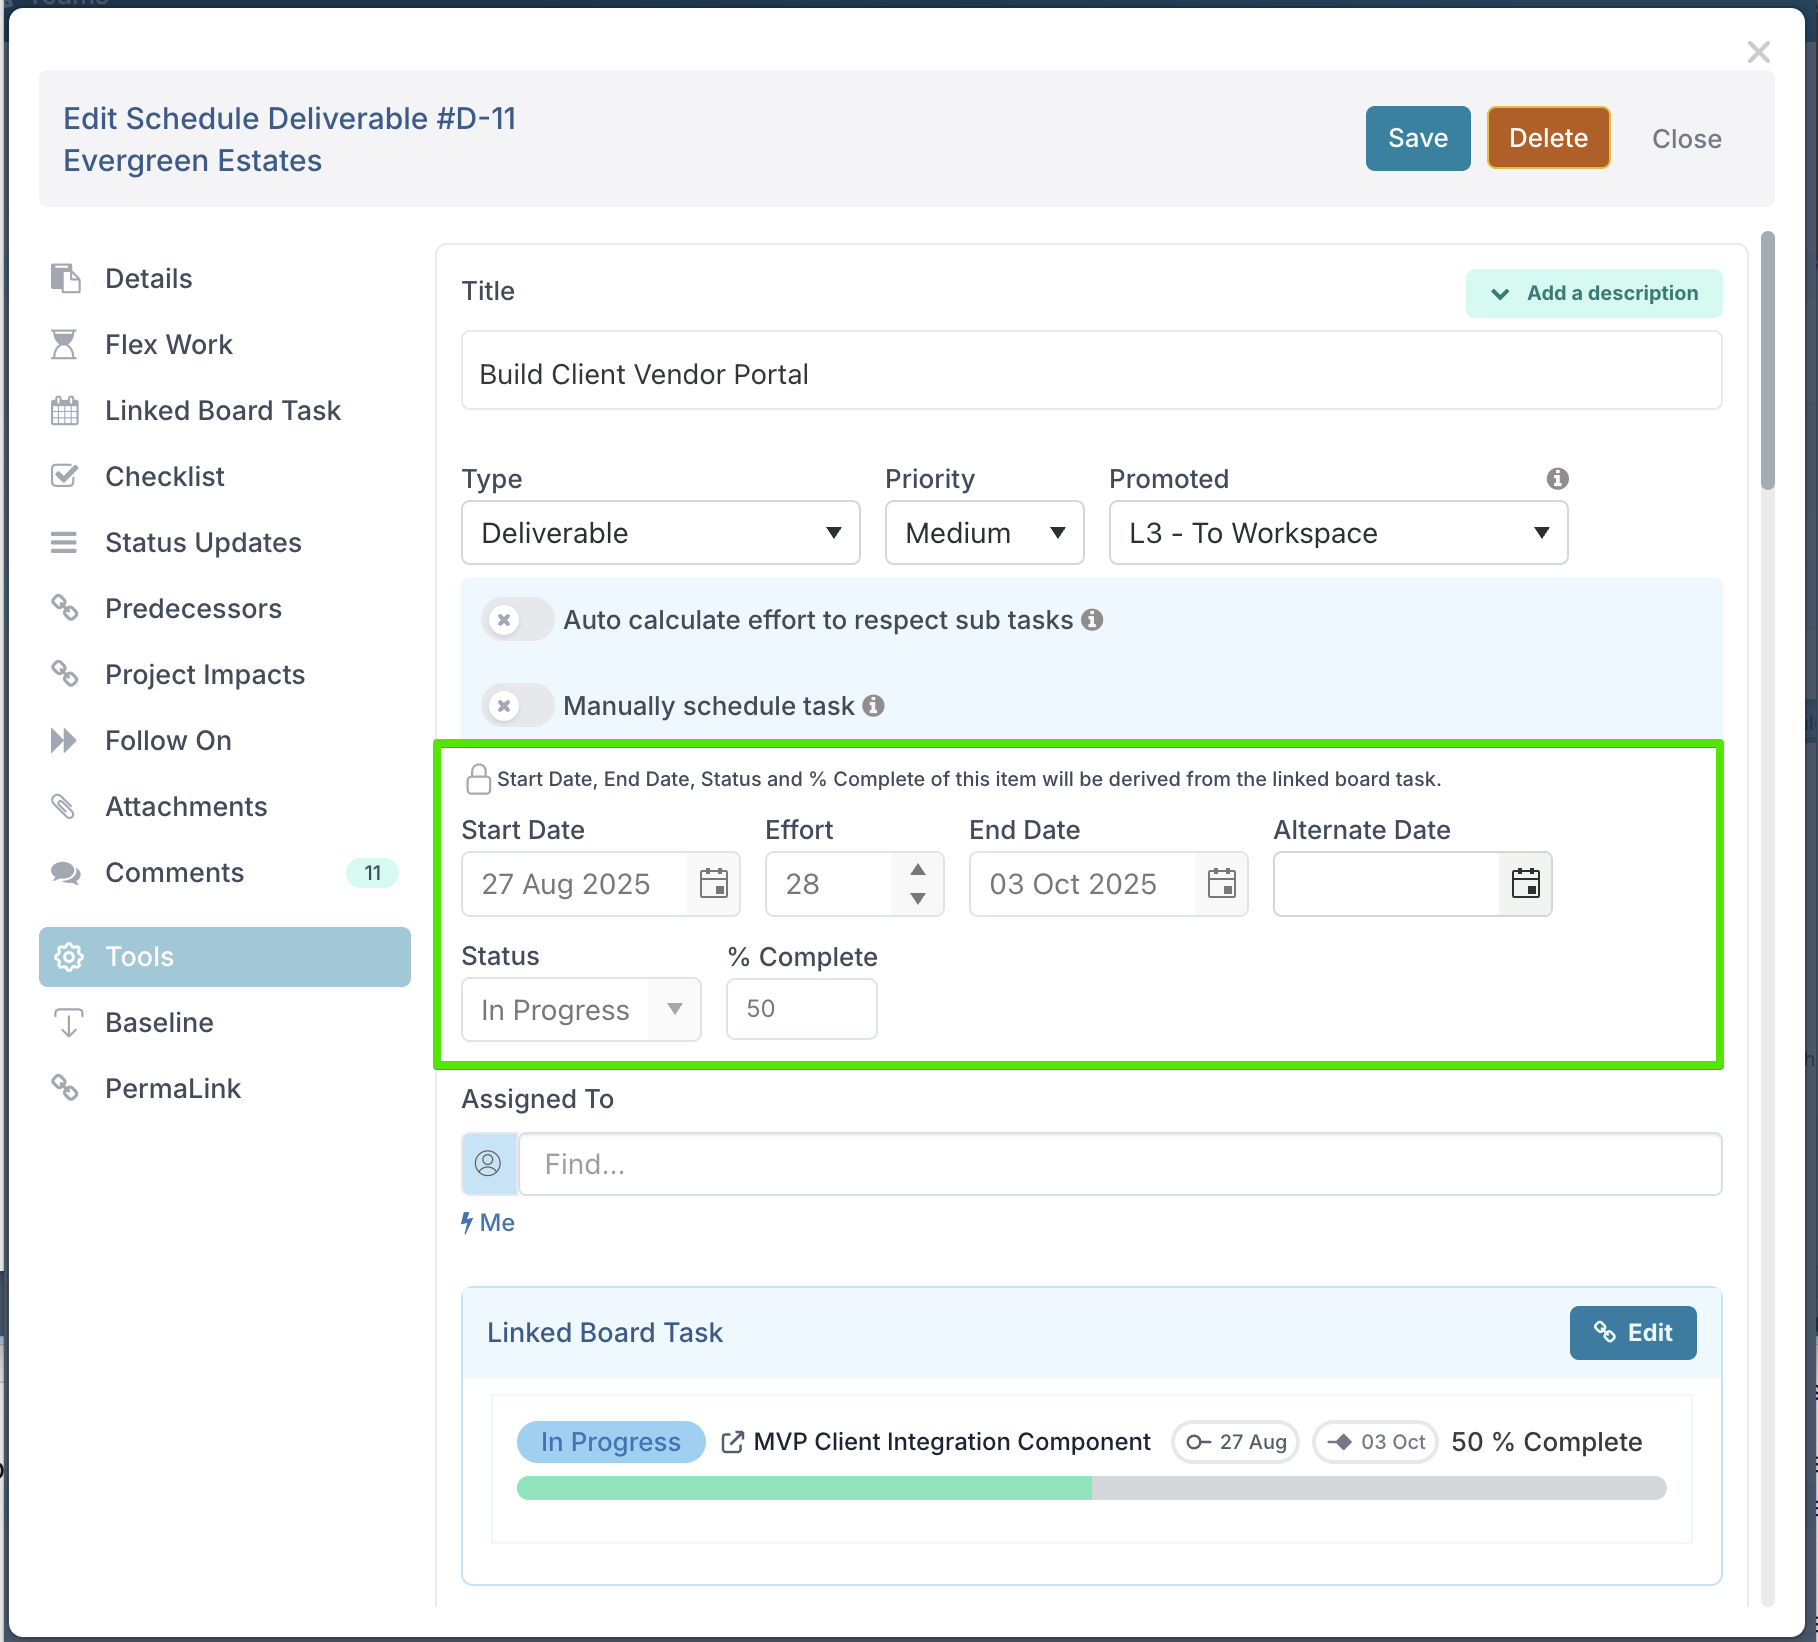
When a board task is linked:
If the board task has both a start date and due date, these dates are applied to the linked schedule task. The dates become locked and cannot be edited manually.
If the board task has only one date or no dates, then the schedule task dates remain editable by the PM.
In all cases, the following are always driven from the board task:
Status
% Complete
This ensures that the project schedule reflects the actual delivery progress and reduces the need for manual tracking.
In the case of mislestone, the following rules apply:
If the linked board task has a due date, it sets the milestone date.
If no due date is present, the milestone date must be set manually.
This enhancement makes it easier than ever to align delivery activity with planning. It brings the flexibility of Agile boards together with the visibility of structured schedules, giving PMOs and project managers a more accurate and integrated view of their projects.
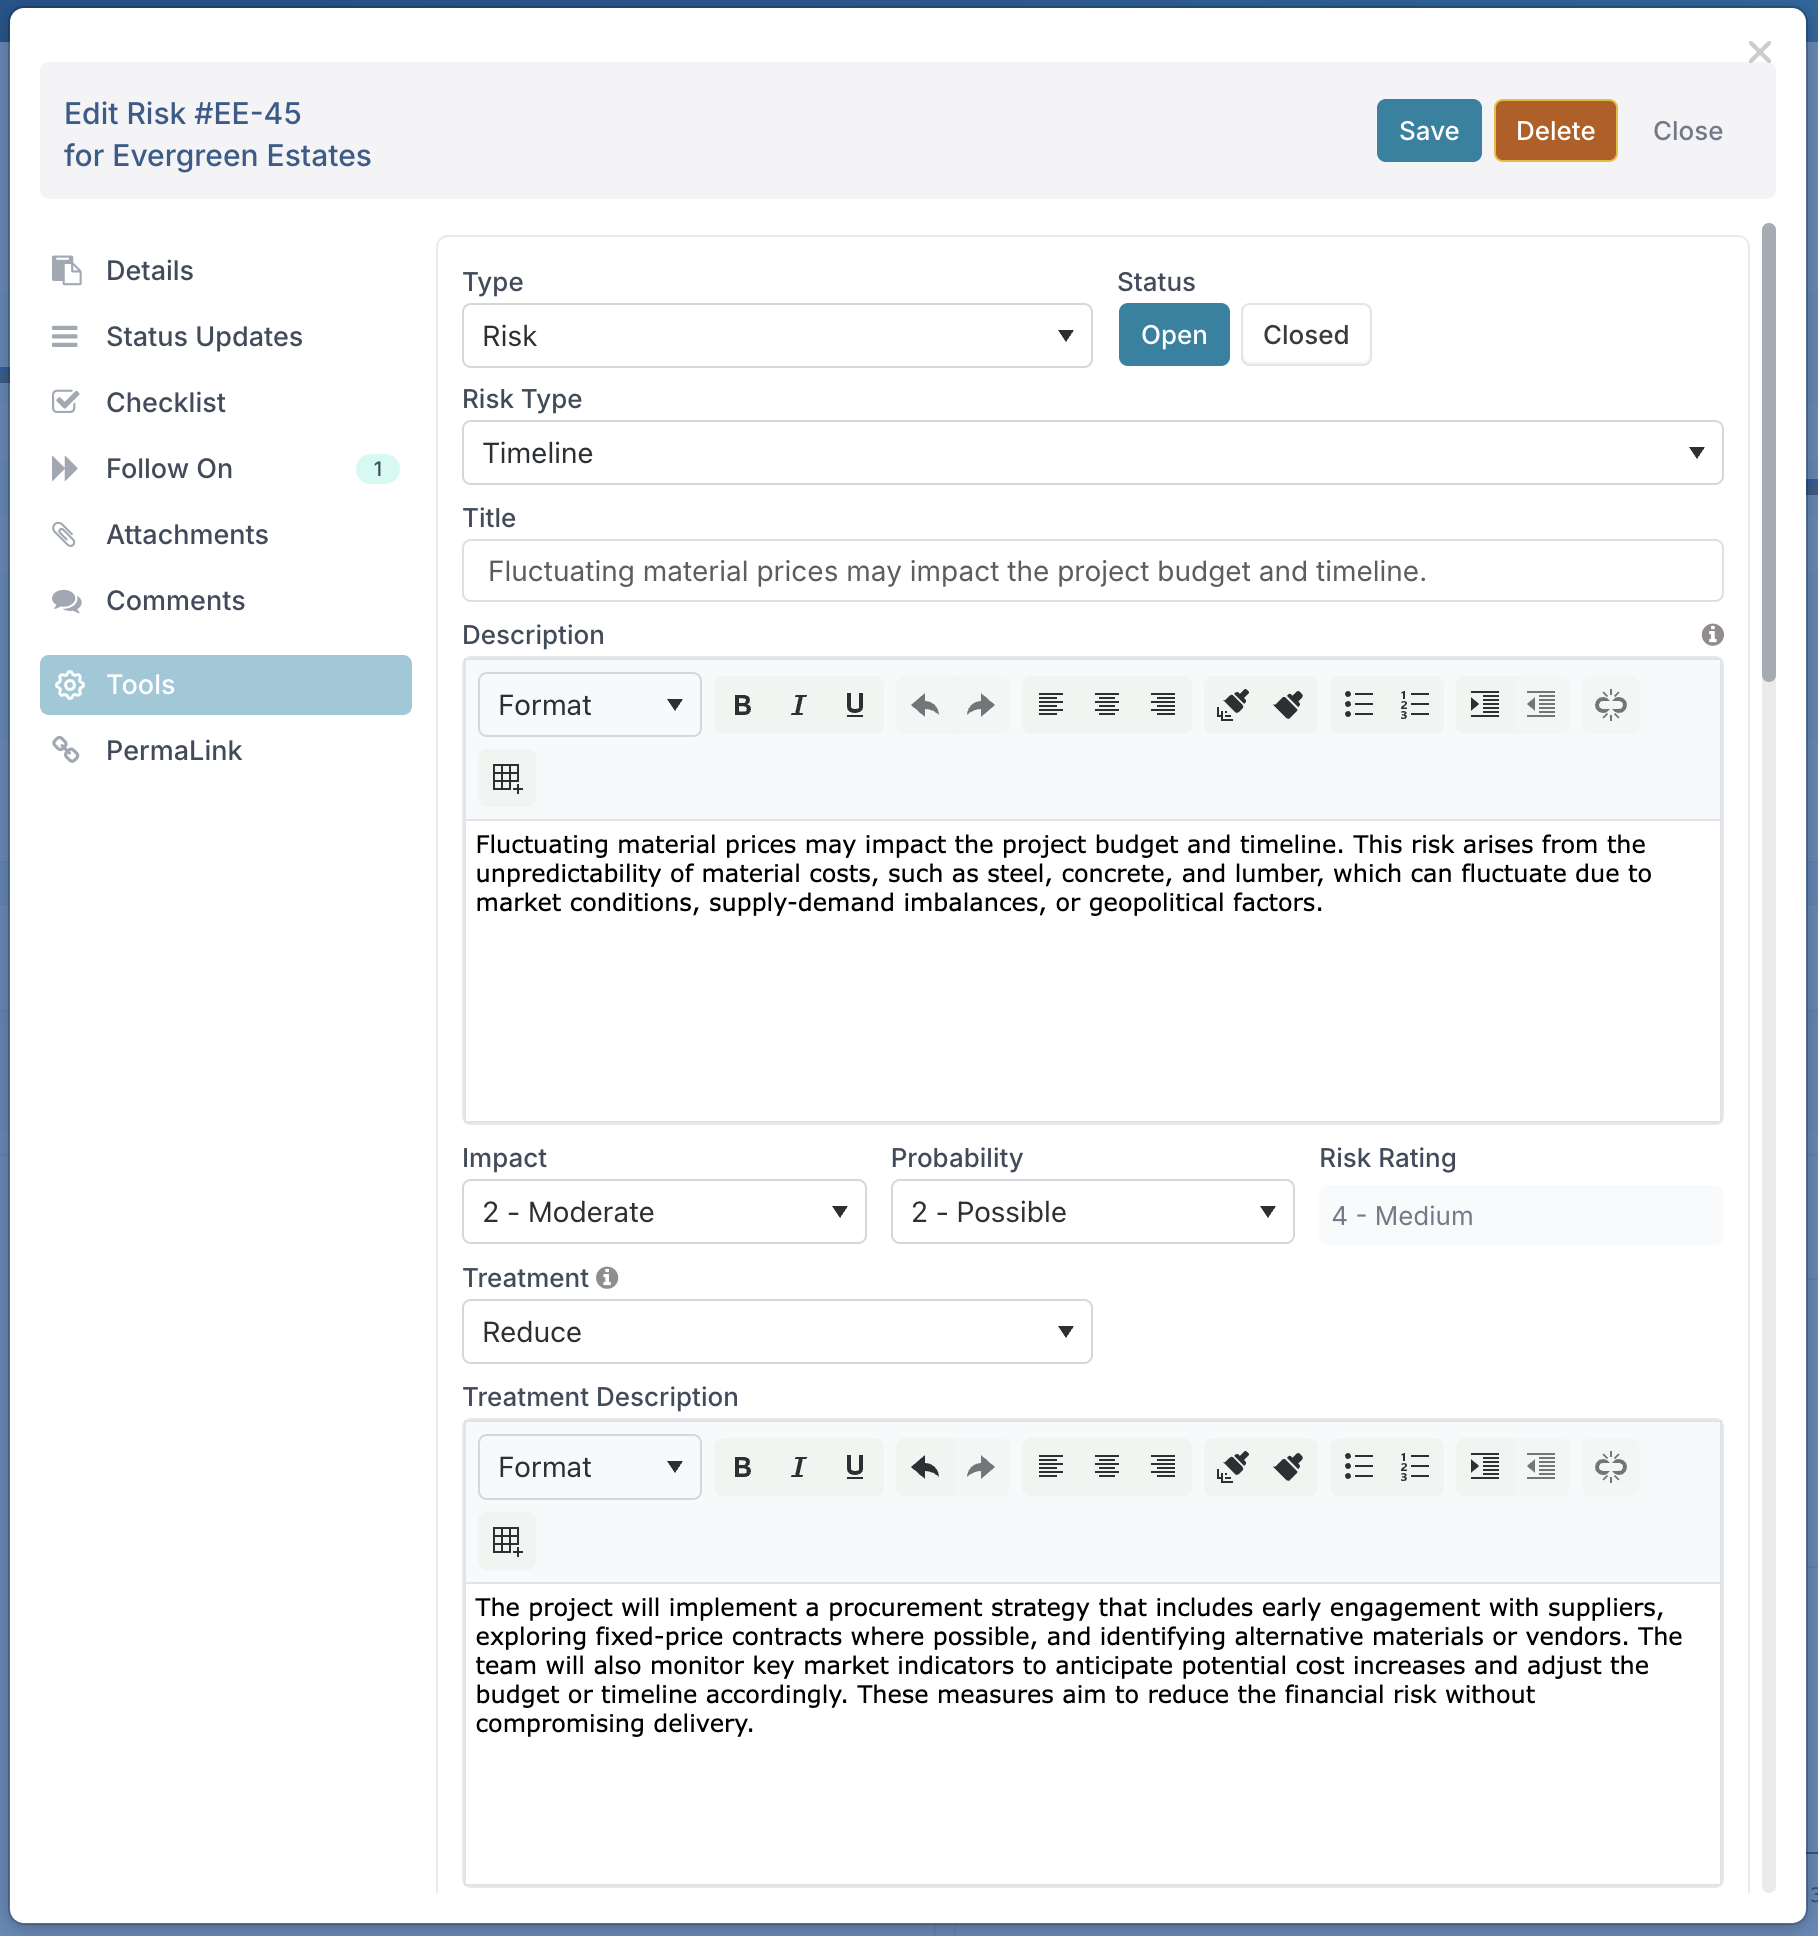
New Risk Treatment Fields to Strengthen Risk Response Planning
To support more robust risk management across projects and portfolios, we’ve introduced two new fields to the Risk form: Treatment and Treatment Description.
The Treatment field allows users to classify each risk based on the chosen response strategy. The available options reflect standard industry approaches:
Avoid – Taking action to eliminate a risk by either not starting or by stopping an activity that carries a risk.
Reduce – Taking actions to reduce the likelihood of a risk occurring or to lessen its potential impact.
Transfer – Shifting the impact or financial consequences of a risk to a third party.
Accept – Acknowledging the existence of a risk and choosing to take no proactive action to mitigate or transfer it.
Exploit – Taking proactive steps to ensure a positive risk, or opportunity, materialises and its benefits are maximised.
The Treatment Description field provides space to document how the selected response will be implemented, offering clarity on planned actions, owners, timelines, or contingency measures.
Together, these fields help project teams go beyond simply identifying risks. They enable them to document, communicate, and track concrete response strategies. For PMOs, this provides a consistent way to assess the quality of risk handling across the portfolio, support governance reviews, and report on risk treatment trends. It also strengthens auditability by ensuring that risks are not just listed but actively managed with a clear plan of action.
This enhancement forms part of our continued investment in governance and assurance, making it easier for organisations to deliver projects with confidence and control.