
December 2025 Release Notes
31st December Patch Release
Fixes
Cascading custom property: In read only dialogs cascading property values not seen.
Hyperlink custom property: Validation error if not set as Required still threw required validation.
26th December Patch Release
Enhancements & Fixes
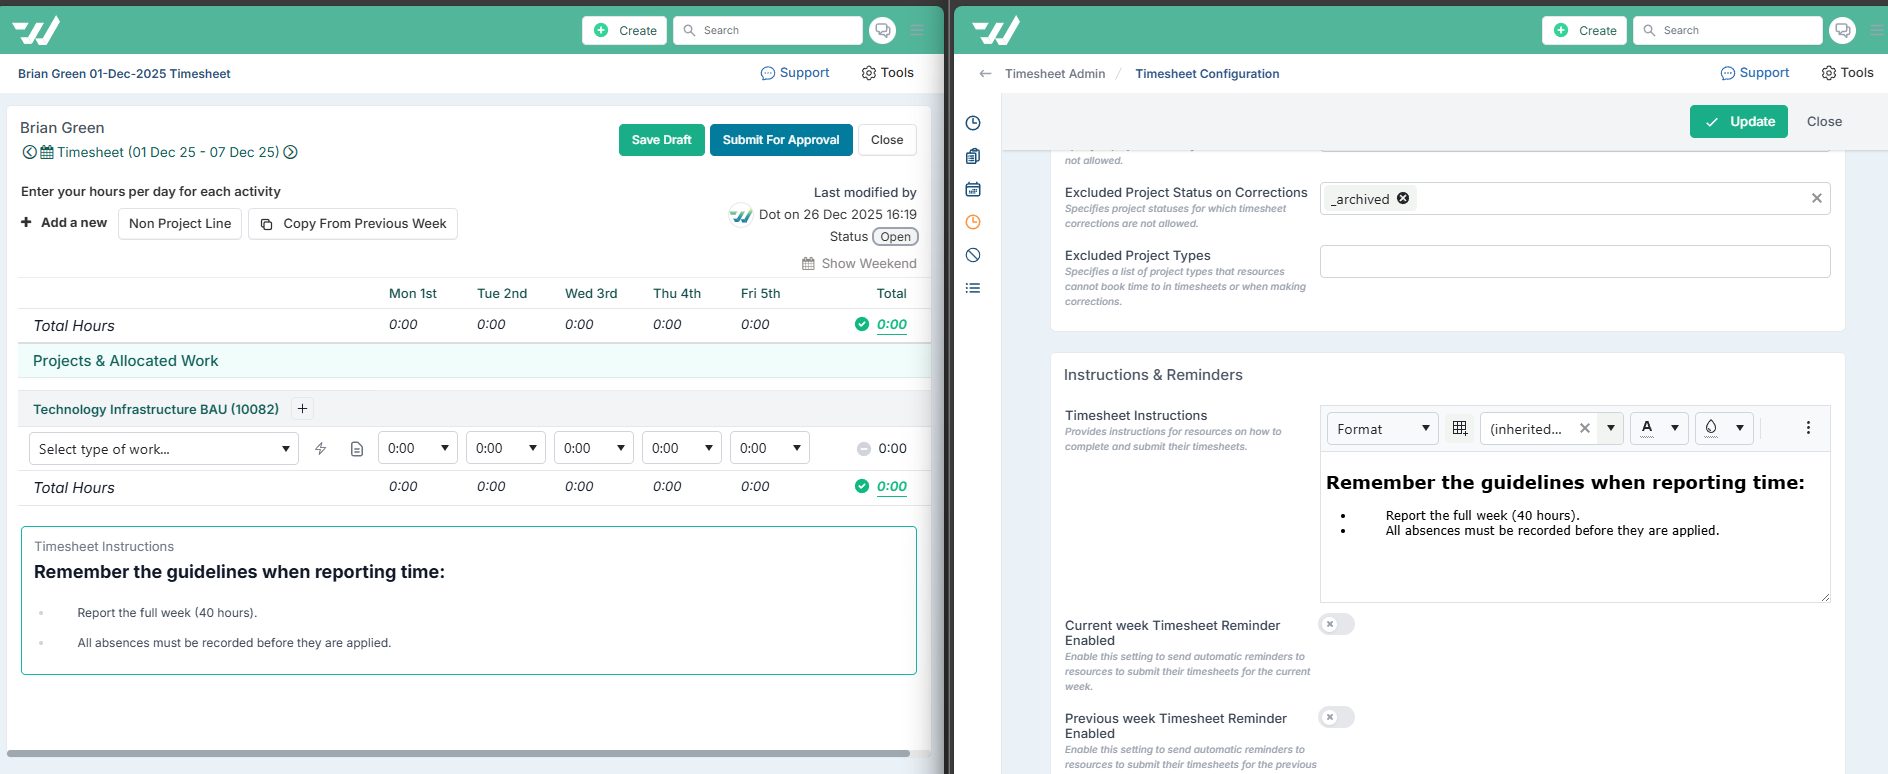
Timesheet Instruction Rendering:Render instructions using the formatting defined in Timesheet Administration > Configure Settings > Timesheet Instructions.
Custom Property Scoping: Fixed an issue where custom property types were not correctly enforced, causing properties intended for specific entities (such as Issues) to appear on others like Risks or Dependencies.
Financial Month Lock: Resolved an issue where the lock month dialog remained stuck in an “updating” state when closing a month due to long-running processes on large data sets; the UI now updates correctly without requiring a manual refresh.
Division / Department / Team Management: Fixed a UI issue where departments and teams temporarily disappeared after assigning a division owner, preventing confusion and the impression that data had been lost.
Executive Roadmap Dashboard: Removed the Dependencies button from the dashboard, as it does not apply in this context.
Timesheets: Fixed an issue where adding new entries to a returned timesheet and saving it as Draft incorrectly changed the status to Open. The timesheet now correctly remains in the Returned status.
22nd December Release
Custom Property Management: Category Grouping, Reordering & Search
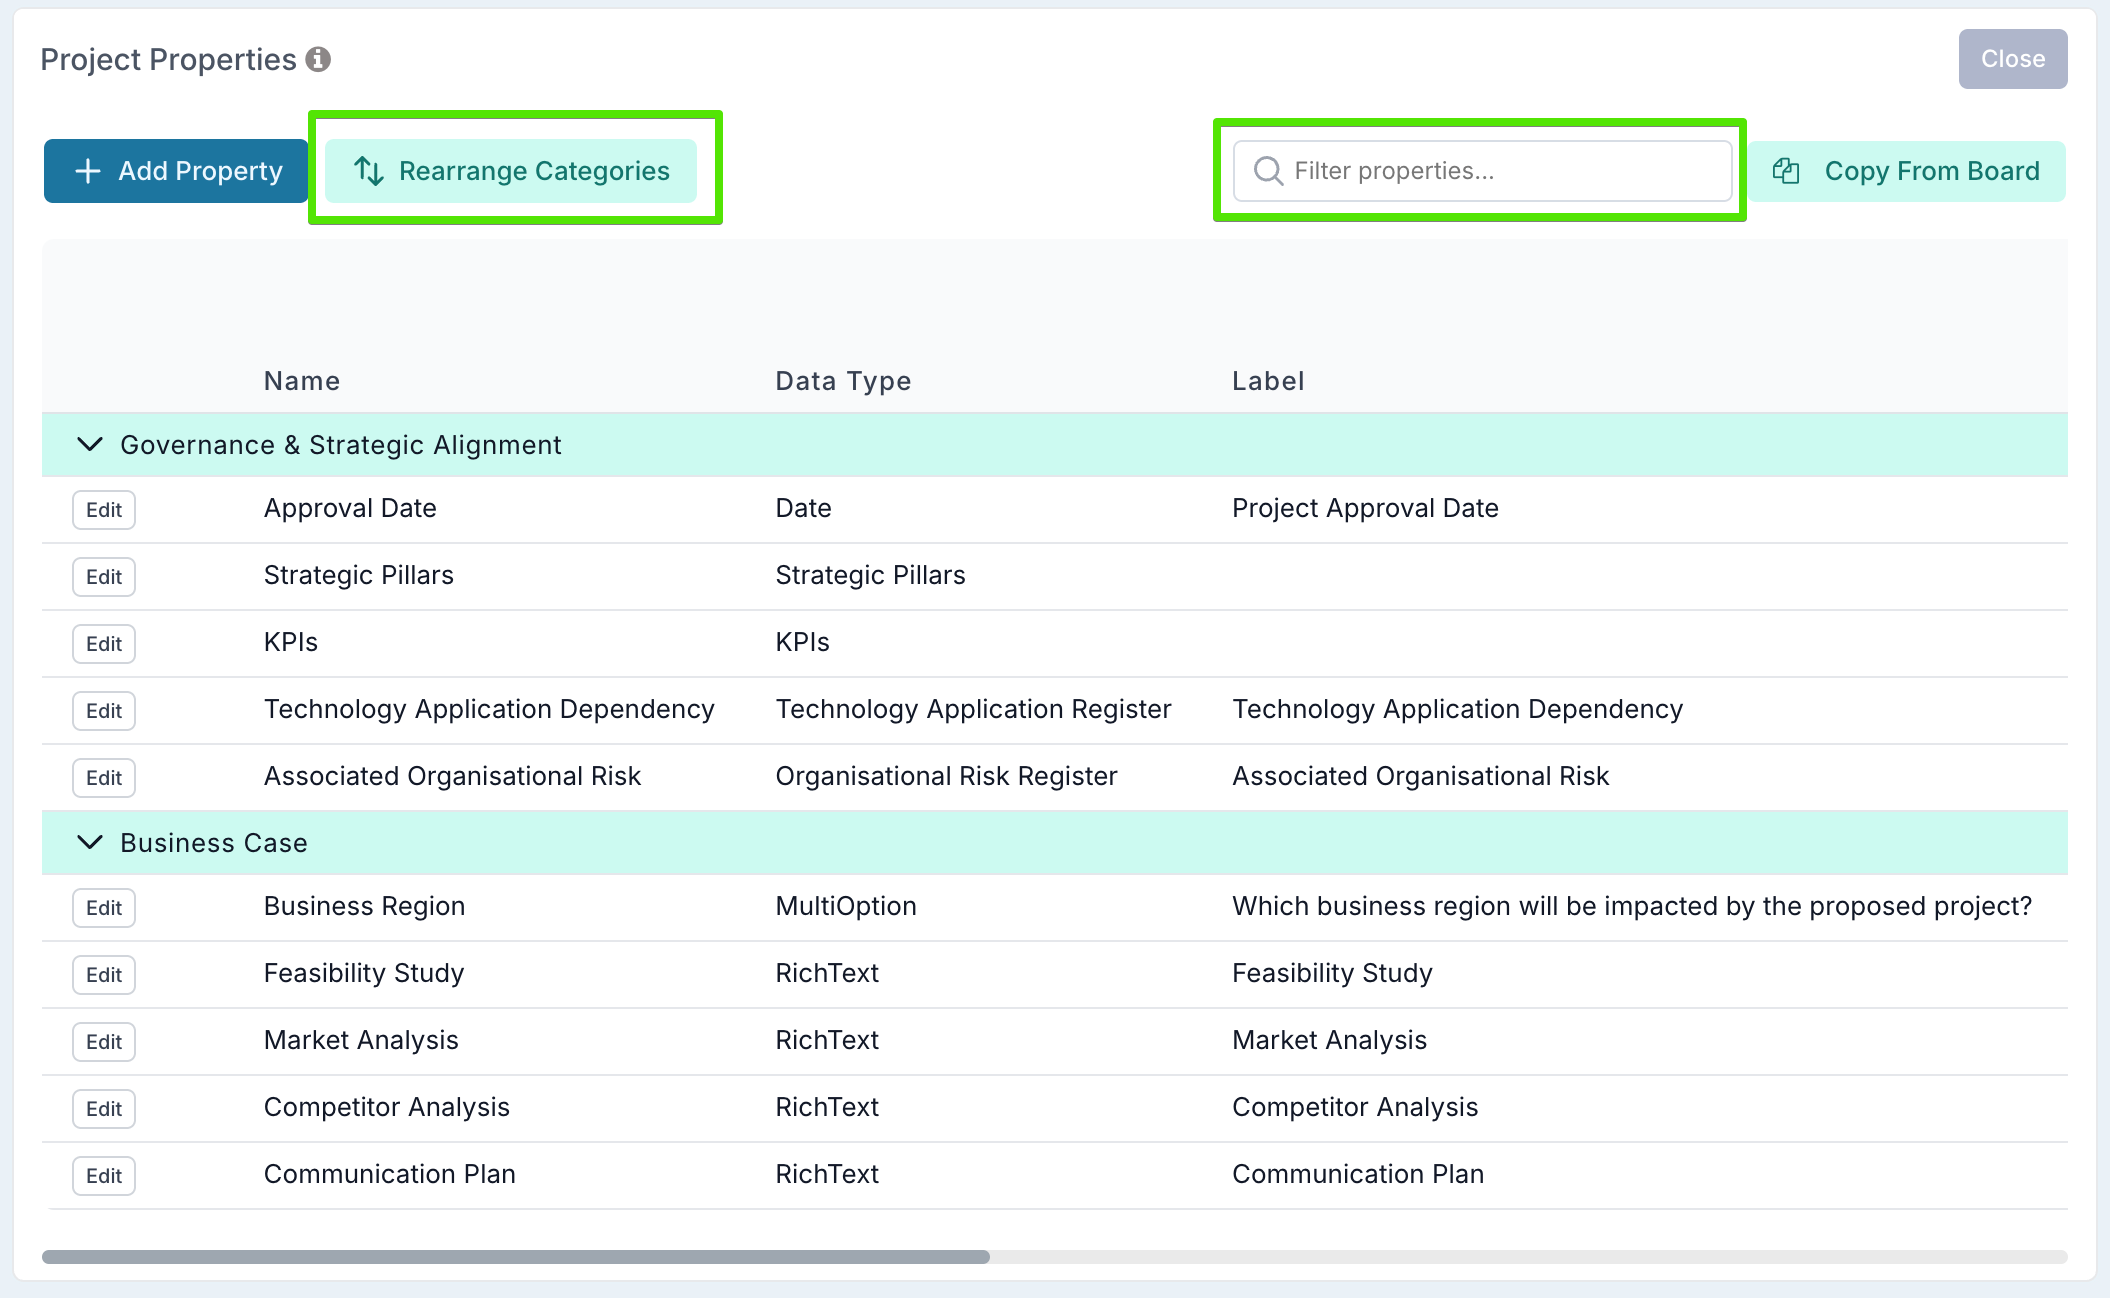
We’ve improved the way custom properties are managed by grouping them by category in the custom property administration page and in the board definition page. Previously, properties were displayed as a single flat list, which could become difficult to navigate as configurations grew. Properties are now clearly organised under their respective categories, making it much easier for PMOs and administrators to understand how data is structured and to manage large sets of properties more confidently.
You can now manage custom properties far more easily using the following capabilities:
Reorder properties within a category using drag and drop to control how they are presented.
Move properties between categories by dragging them from one category to another, making it simple to reclassify properties as your governance model evolves.
Reorder categories themselves by selecting the Rearrange Categories button and dragging categories into the required order.
Quickly find specific properties using the Filter properties search, which is especially helpful when working with a large number of custom properties.
These improvements make the page significantly easier to work with at scale, while also giving PMOs clear visibility into how properties will be structured and displayed across projects, schedules, and other entities, as the same category and property order is consistently applied wherever those properties are used.
Cascading Property Values
We’ve introduced a new Cascading Option data type for custom properties, allowing you to create properties where selecting one value filters the available options in the next.
For example, you might use a cascading property to capture location data, where selecting a Region automatically filters the list of Countries, and once a Country is chosen, only the relevant Cities are shown. Or, in a governance and portfolio context, you might use it to classify investments — where selecting an Investment Category determines the available Investment Drivers, and selecting a driver then determines the valid Benefit Types.
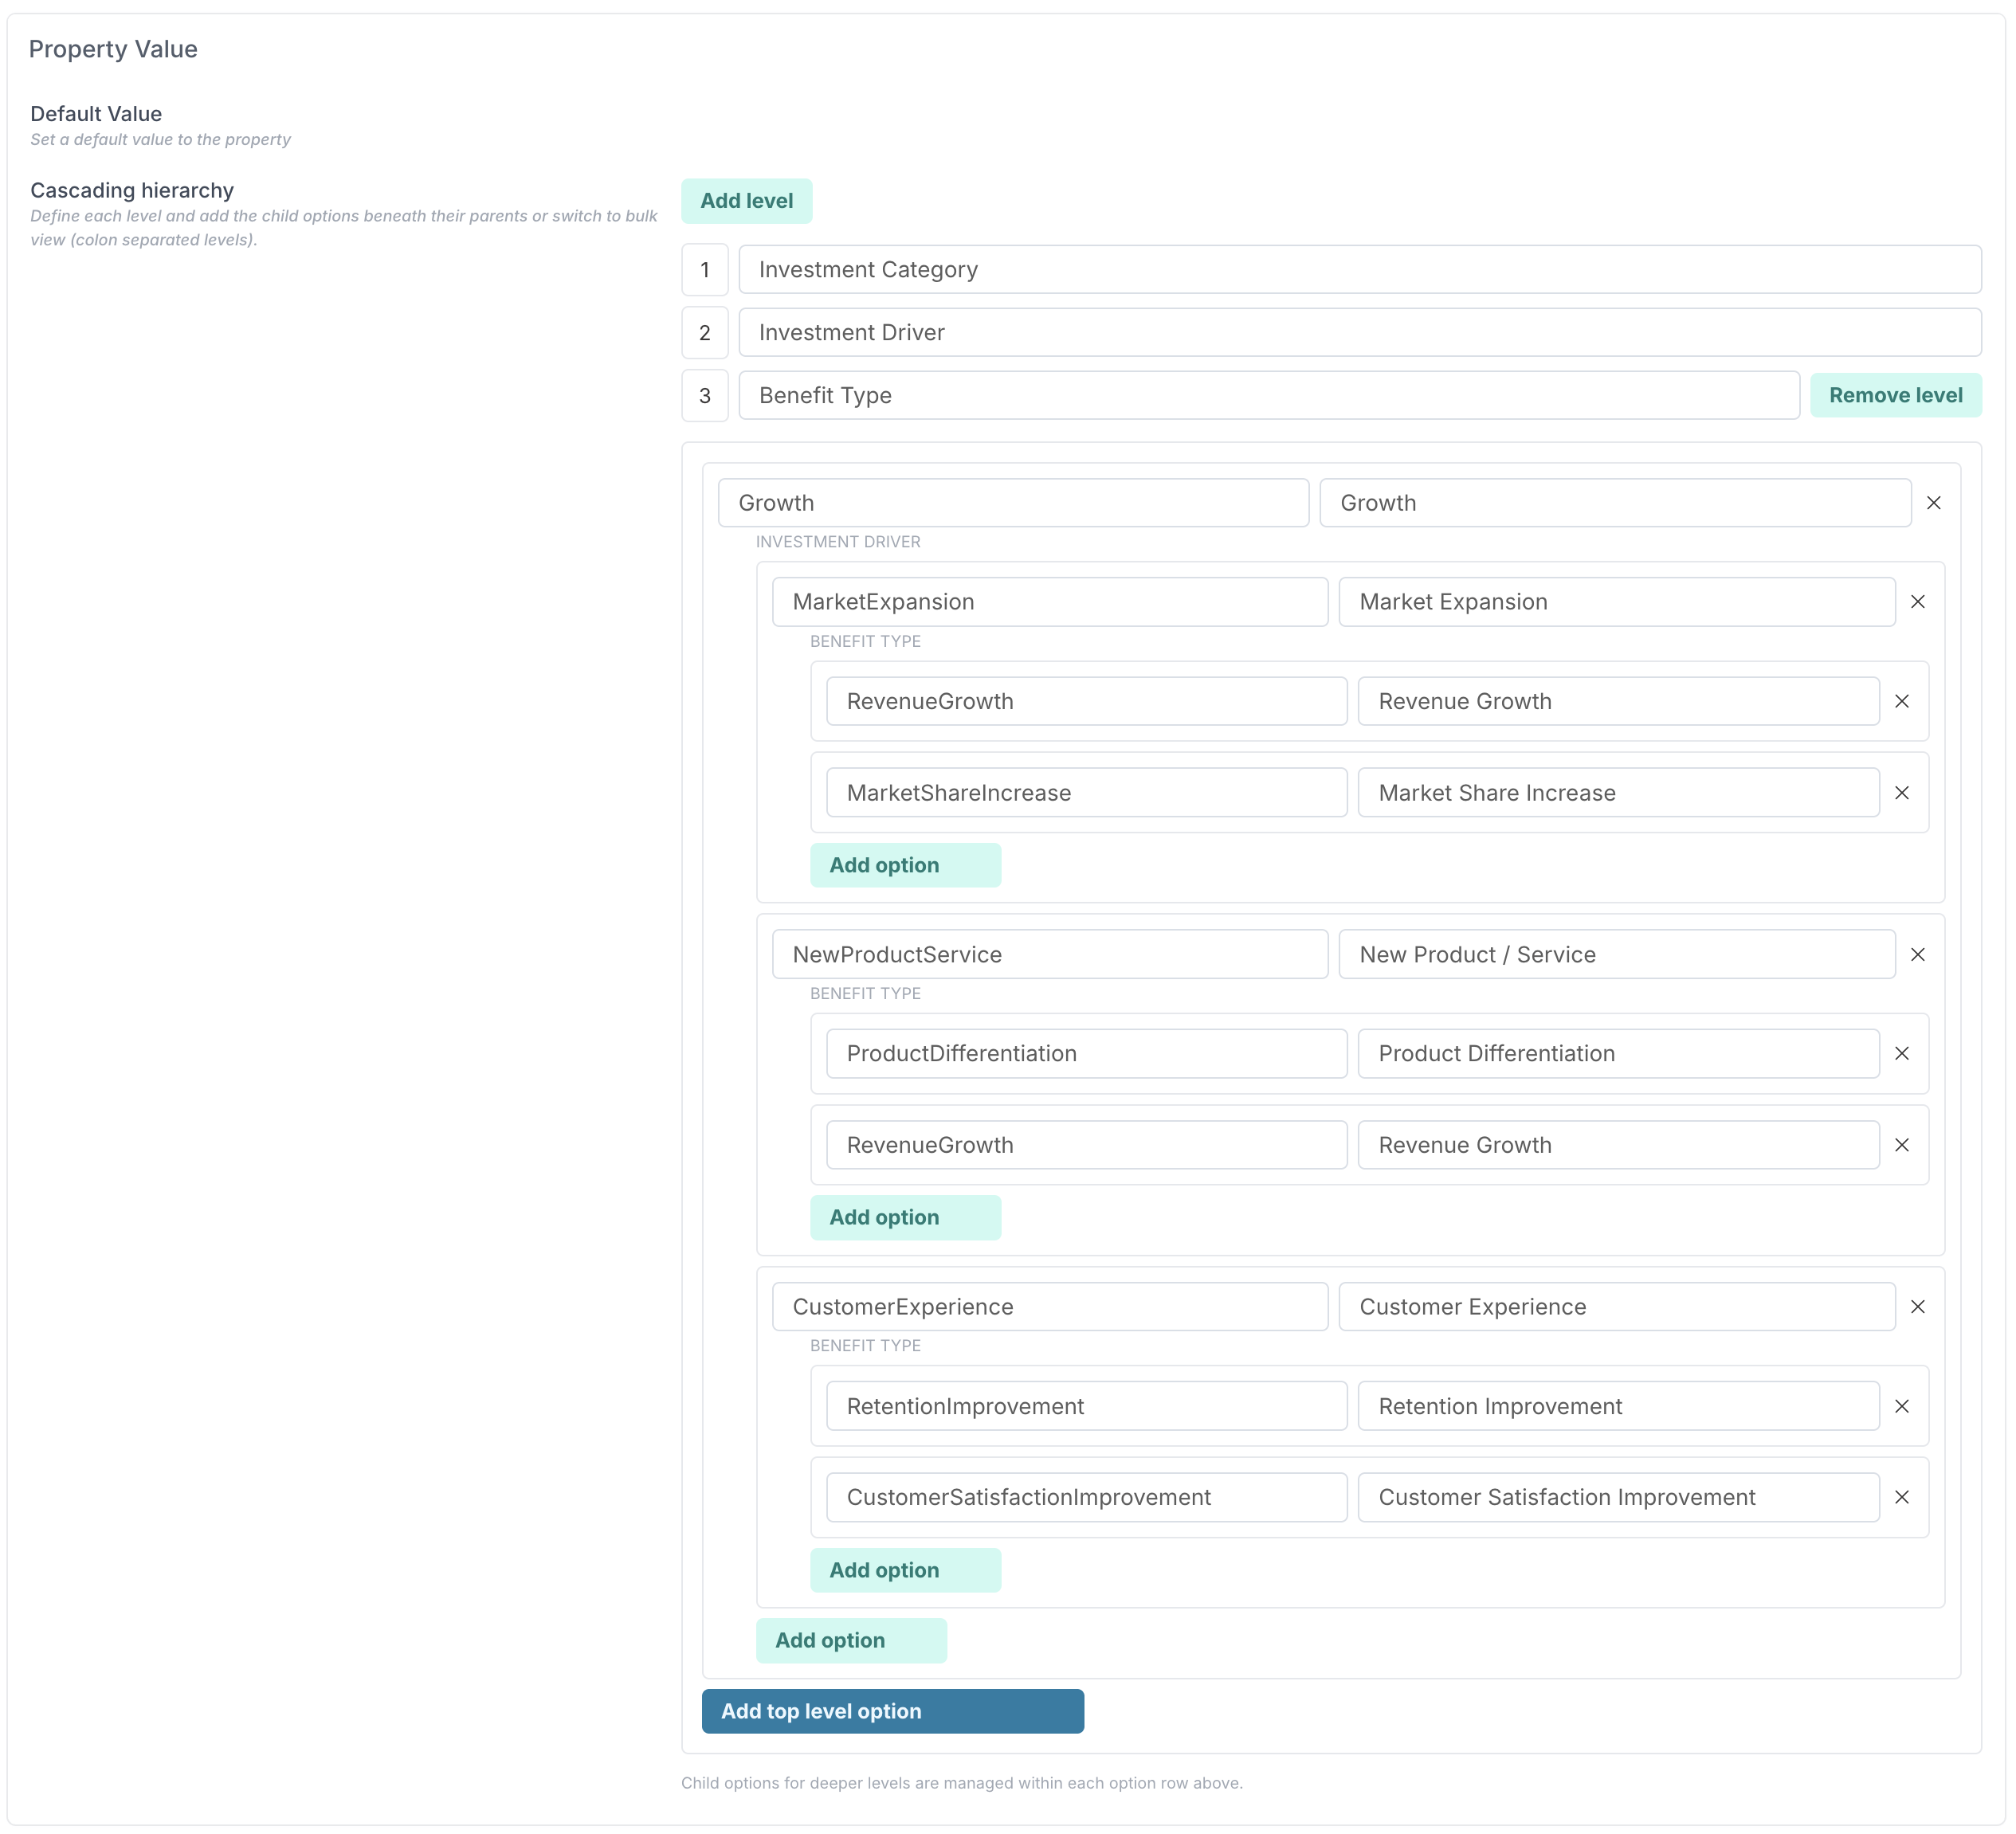
To create a cascading property, set the Data Type to Cascading Option and define your hierarchy by adding the levels you need — for example:
Investment Category → Investment Driver → Benefit Type.
For each level, you define which values sit under each parent. There’s no limit to the number of levels you can configure.
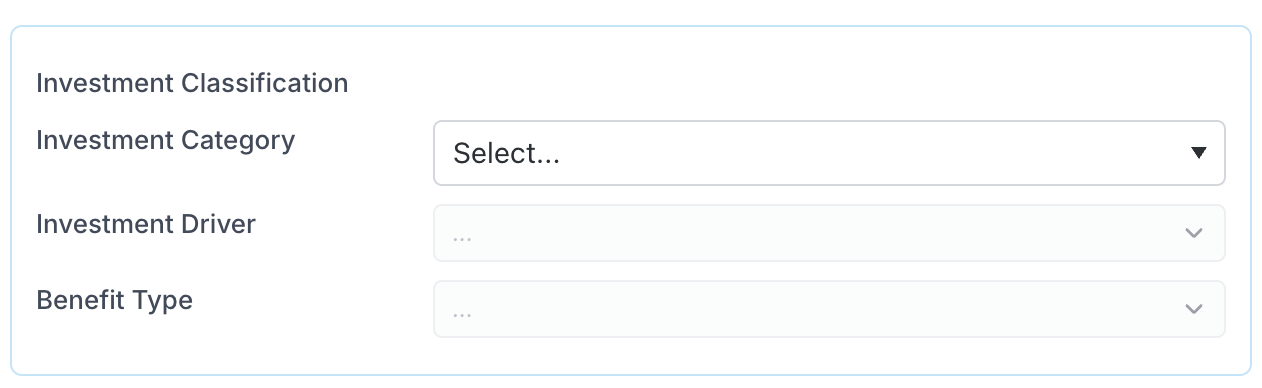
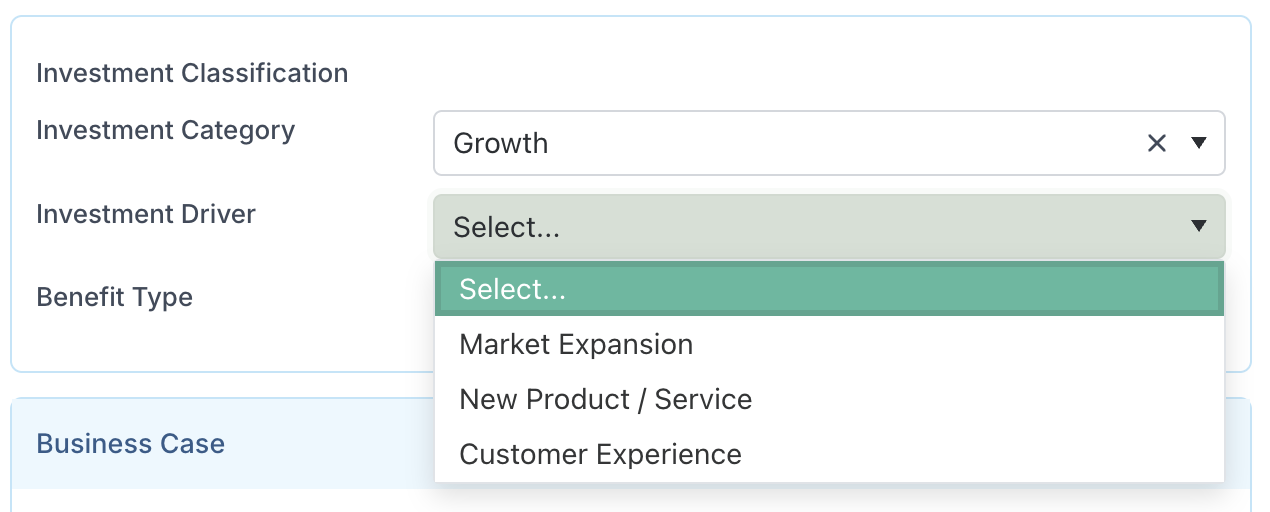
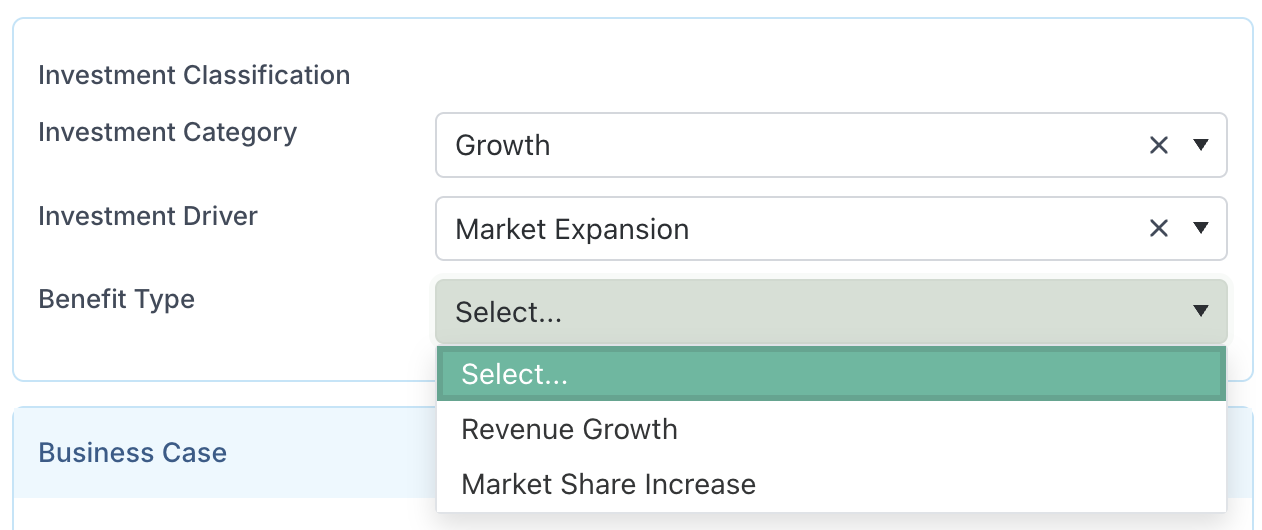
When entering a value, the cascade is completed from top to bottom. Users first select an Investment Category. Once selected, the Investment Driver field becomes active and only shows the drivers valid for that category. After choosing an Investment Driver, the Benefit Type field is enabled and filtered to show only the benefit types associated with that driver. This guided flow ensures users can only select valid combinations and makes it clear which information is required at each step.
This helps ensure consistent classification across projects, boards, impacts, and other workspaces, while reducing the risk of invalid or inconsistent combinations.
Please note that when using bulk edit or exporting data to Excel, each level of the cascade is shown as a separate column (for example: Investment Category, Investment Driver, Benefit Type), enabling clear reporting, filtering, and analysis across your portfolio.
Copy Custom Properties Between Boards and Projects
You can now copy custom properties directly from an existing board into another board or into project properties, making it much easier to maintain consistent data definitions across intake workflows and project workspaces.
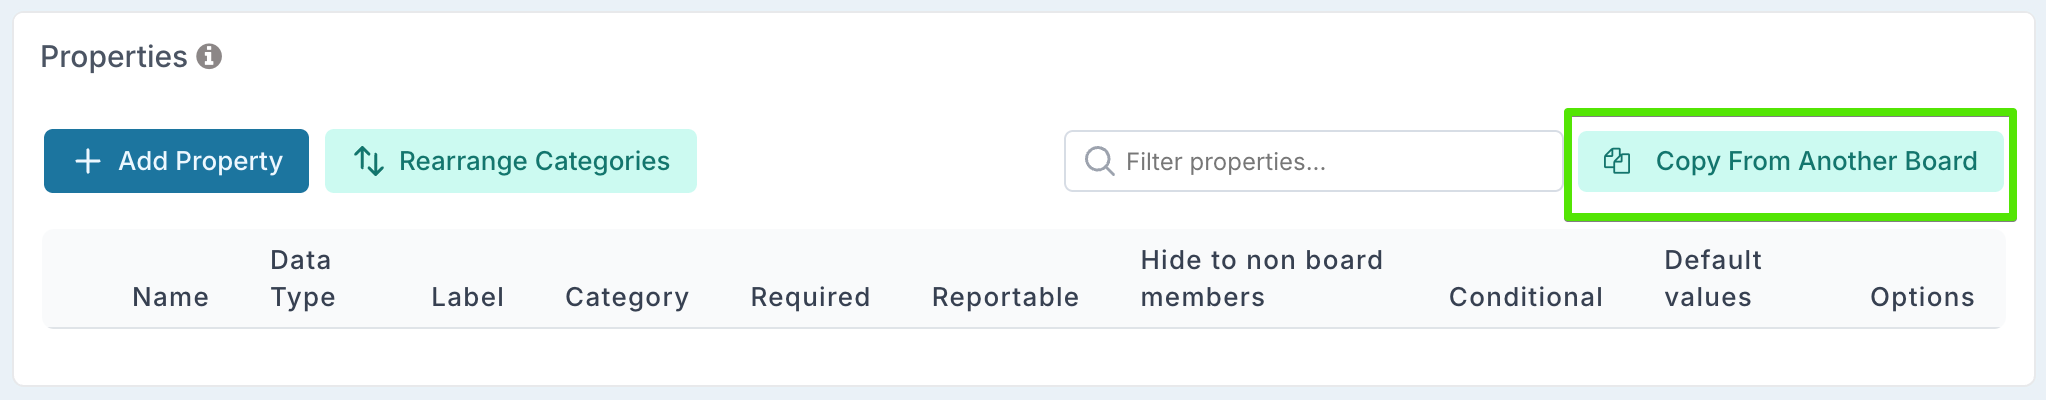
From the Board Settings or Project Properties page, select Copy from Board and choose the source board.
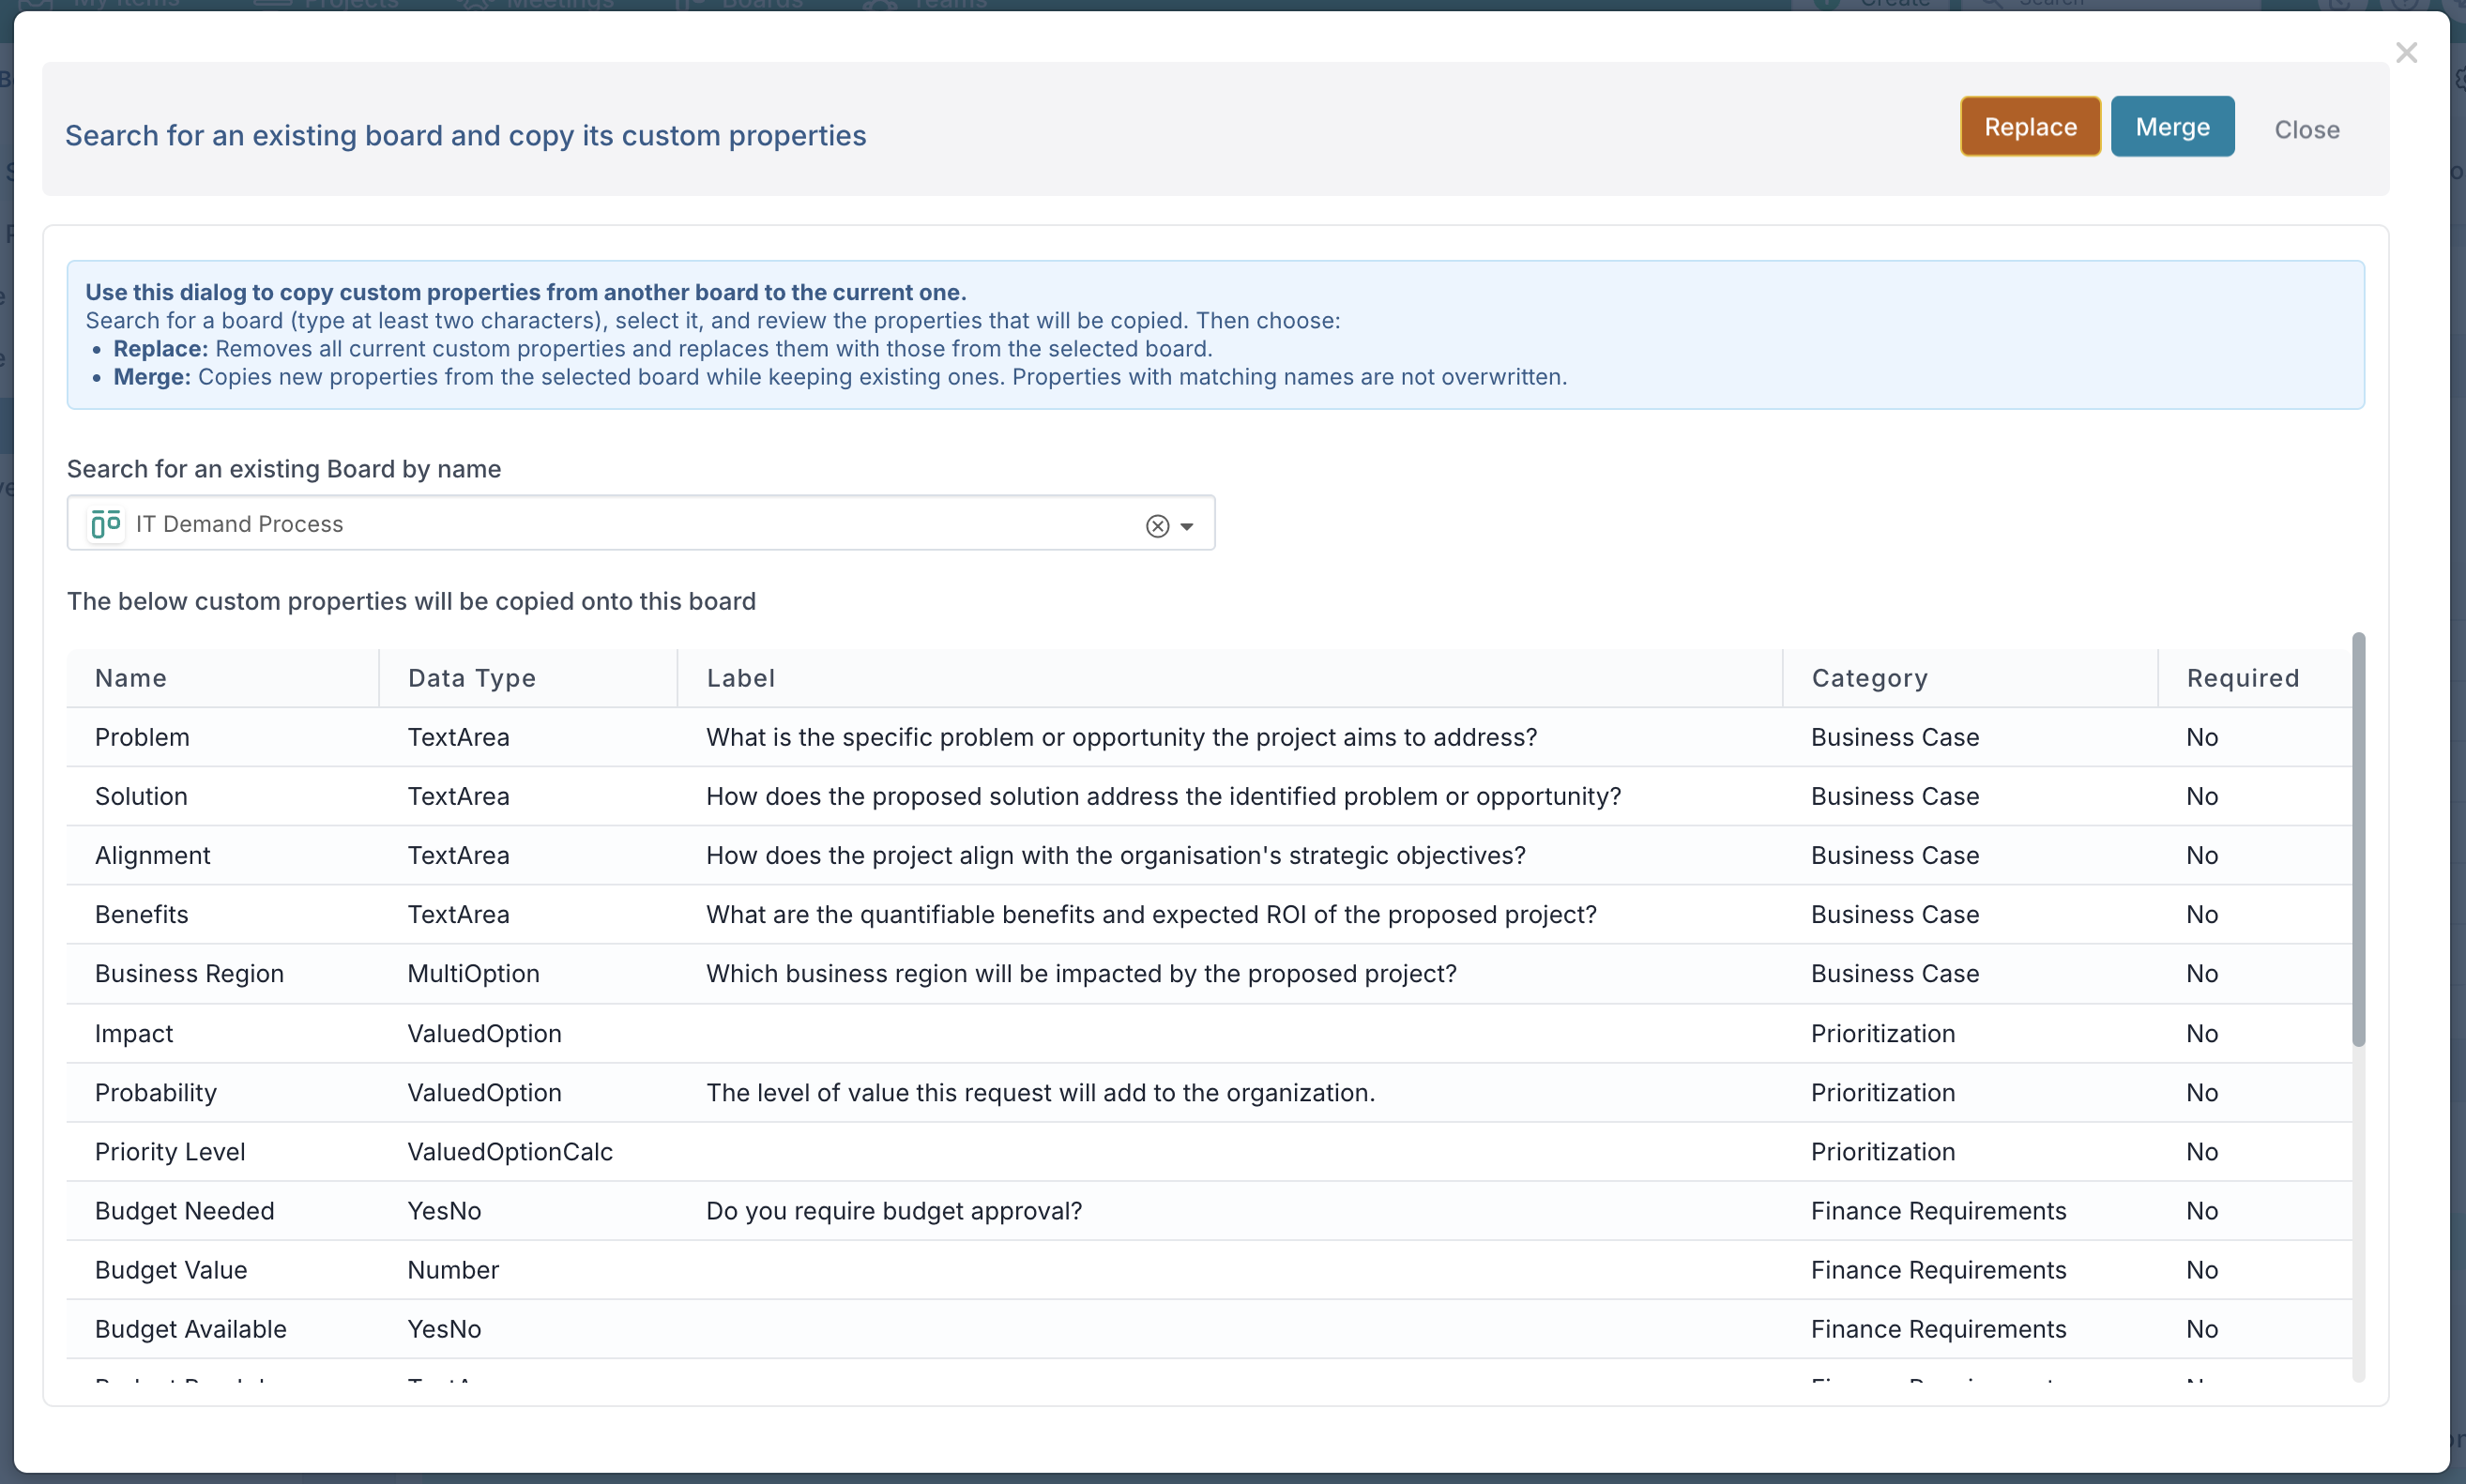
The list properties available to copy will be displayed, giving you full visibility before applying any changes. You can then choose how the properties are applied:
Replace – removes the current set of custom properties and replaces them entirely with those from the selected board
Merge – adds only properties that do not already exist, leaving any matching properties unchanged
This flexibility allows you to reuse and standardise property definitions without duplicating entire boards or re-creating fields manually.
This is particularly valuable when:
ensuring project properties match board properties so values can synchronise cleanly from request to project
rolling out consistent configurations across environments (for example from sandbox to production)
By making it easy to reuse property definitions in both boards and projects, this feature reduces configuration effort, improves data consistency, and helps ensure that information captured during intake flows reliably into project delivery.
Fixes
Resource Allocation: The resource name column is now frozen in the Community Allocation edit grid, ensuring resource names remain visible when scrolling horizontally across months.
Impact: Fixed an issue with group sorting when items had undefined or empty values,
12th December Patch Release
Enhancements & Fixes
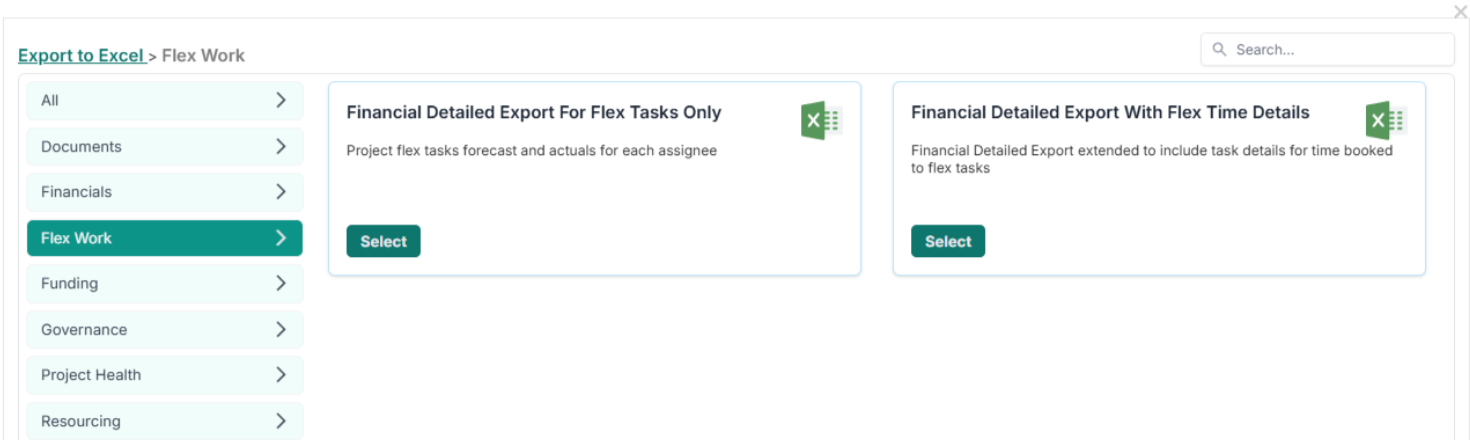
Project Reports: We have added a Financial Detailed Export for Flex Schedule details, allowing you to see the total forecasted cost and hours effort per task on you project schedules.
Rate Cards: Updated the rate card edit dialog to allow both Capped and Daily options to be deselected.
10th December Patch Release
Enhancements & Fixes
Process Boards: Fixed an issue where grouping cards by date did not respect timezone settings.
Email Notifications: Fixed an issue where some users were not receiving email notifications.
9th December Patch Release
Enhancements & Fixes
User Management: Fixed an issue where the user count displayed in the User Management Console was incorrect.
3rd December Patch Release
Enhancements & Fixes
Project Dashboards: You can now use Valued Option project properties when configuring pie charts, allowing you to visualise weighted values directly in dashboard charts.
Boards: Fixed an issue so that Group By and Filter By Project options are only available on Pipeline Boards, as intended.
2nd December Patch Release
Timesheet Administration Page
Timesheet Administrators now have full visibility of all timesheets that have been submitted but not yet approved. To support this, the Approvals component includes two new filters:
Timesheet Admin Approvals – shows only the timesheets that the Timesheet Administrator is responsible for approving (i.e. timesheets submitted by resources with no manager set).
All Unapproved Timesheets – shows every submitted but unapproved timesheet across the organisation, regardless of who the approver is.
These enhancements give Timesheet Administrators far greater visibility and control, making it easier to manage outstanding approvals and maintain compliance.
1st December Release (v. 16.4.33608 )
1. Schedule Enhancements
We’ve delivered a series of improvements to the Schedule to strengthen visibility, streamline navigation, and provide richer context directly within the grid and Gantt views. These updates help project teams review plans more efficiently, identify risks earlier, and manage complex schedules with greater confidence.
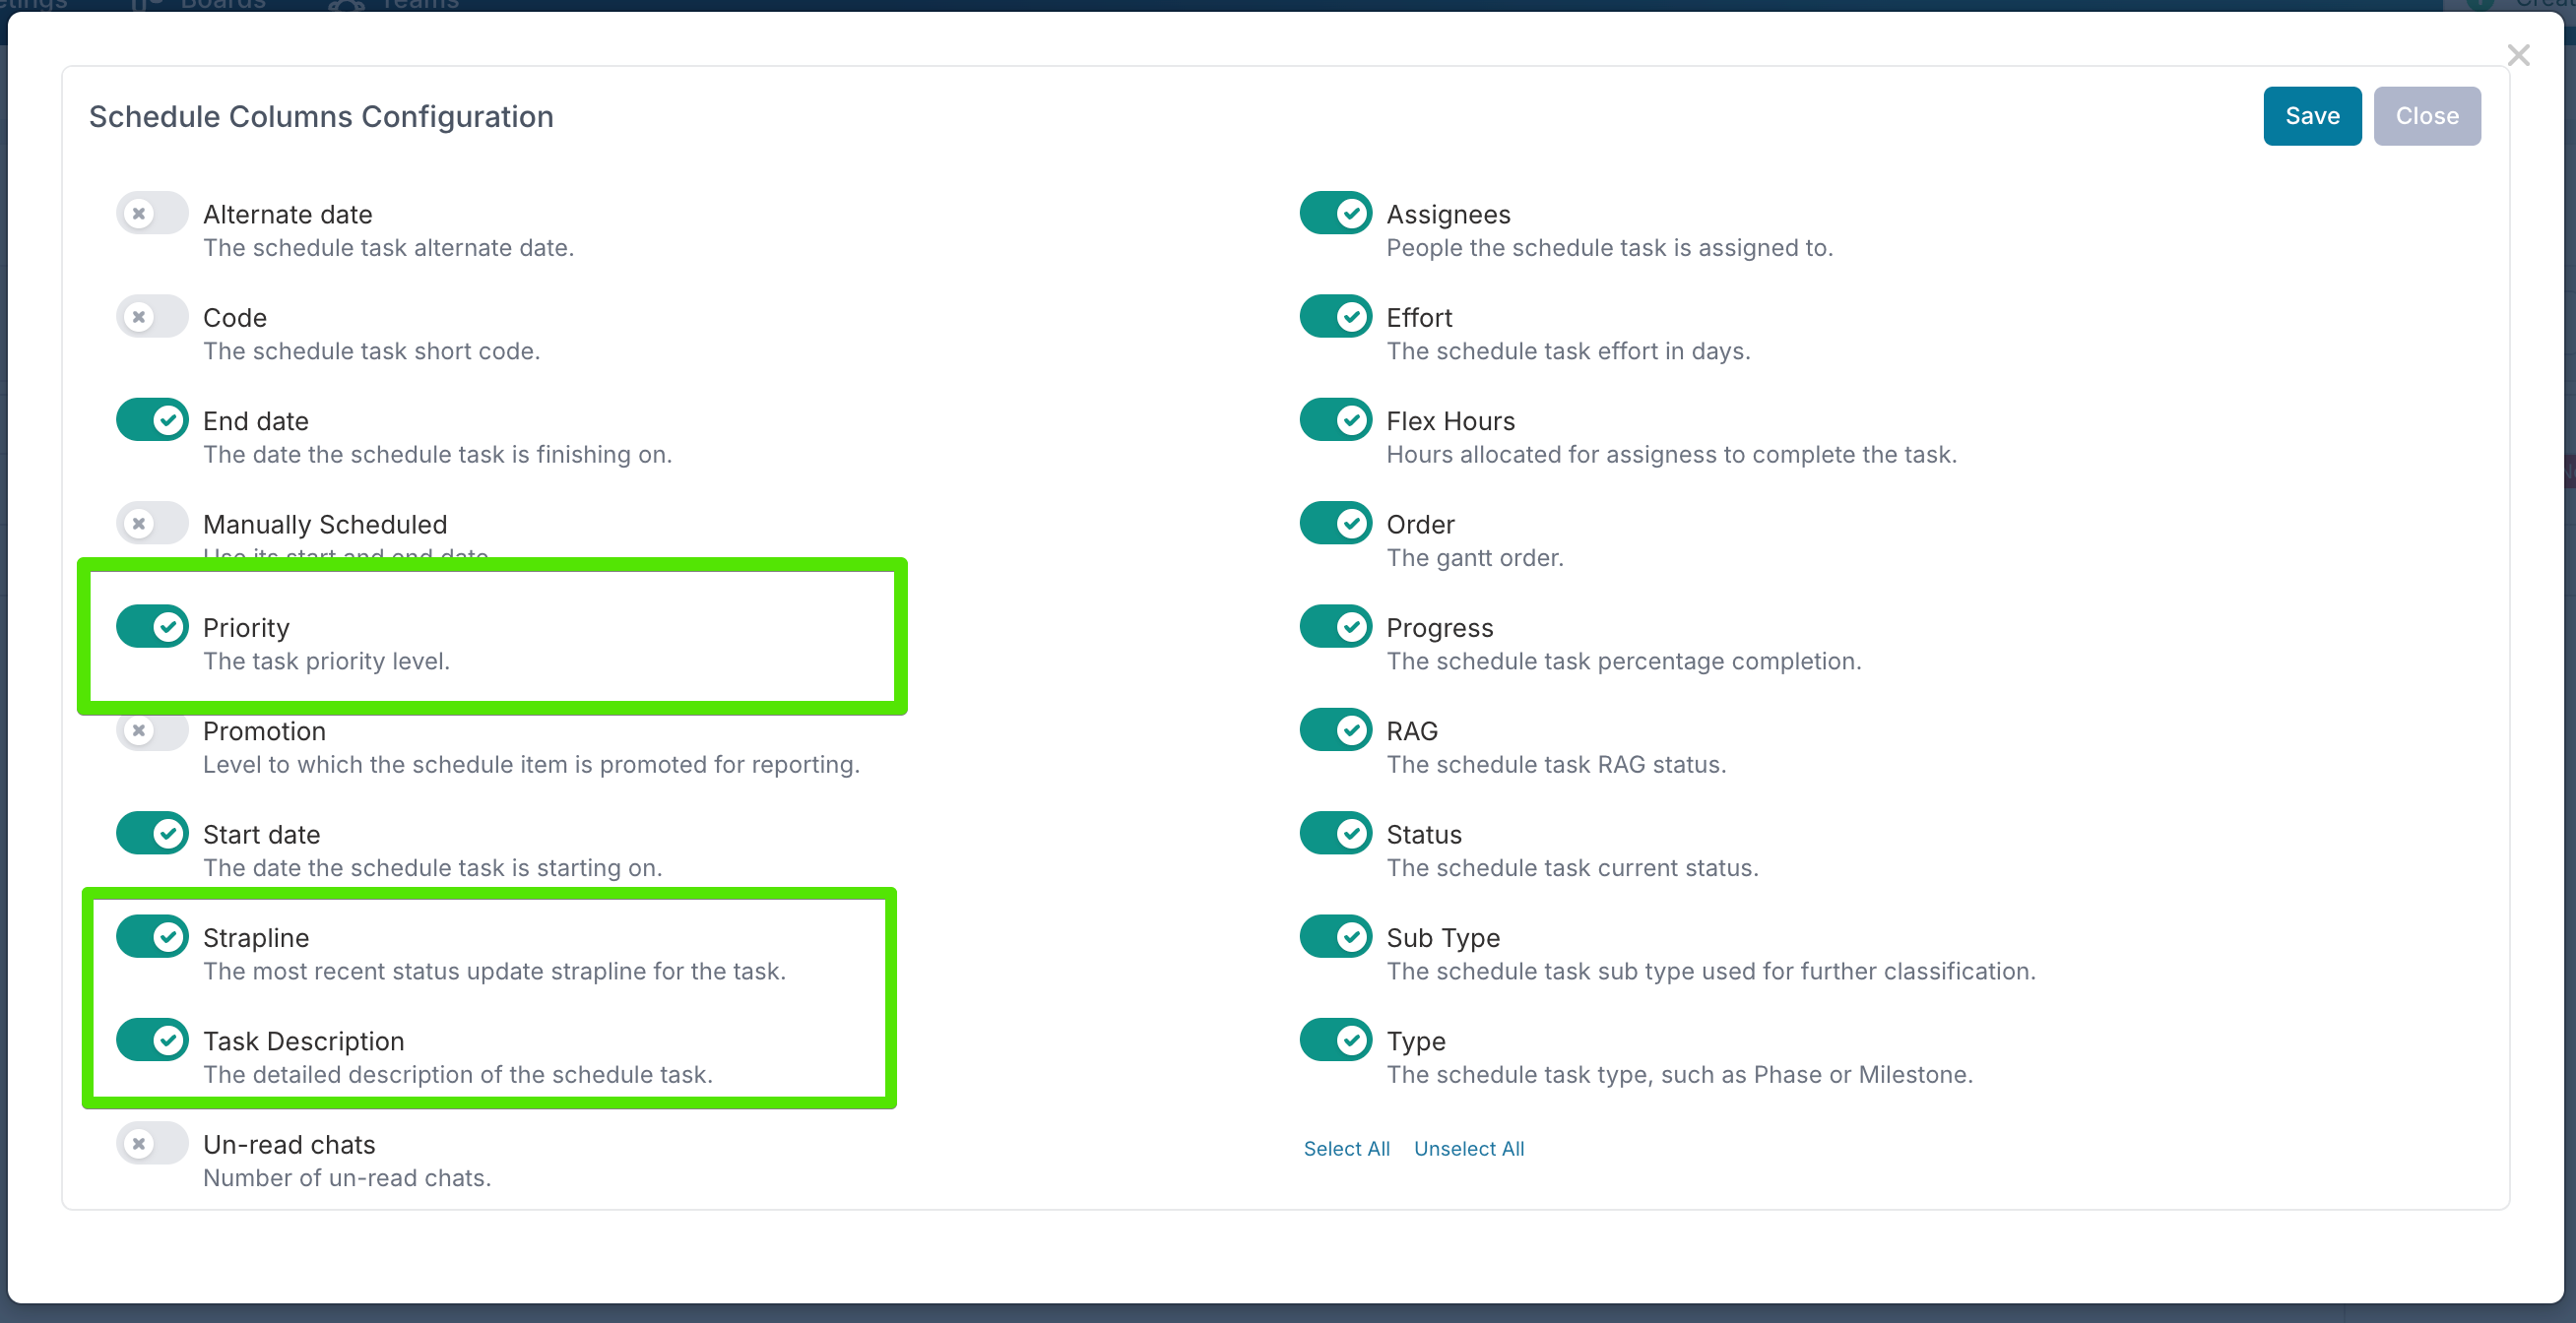
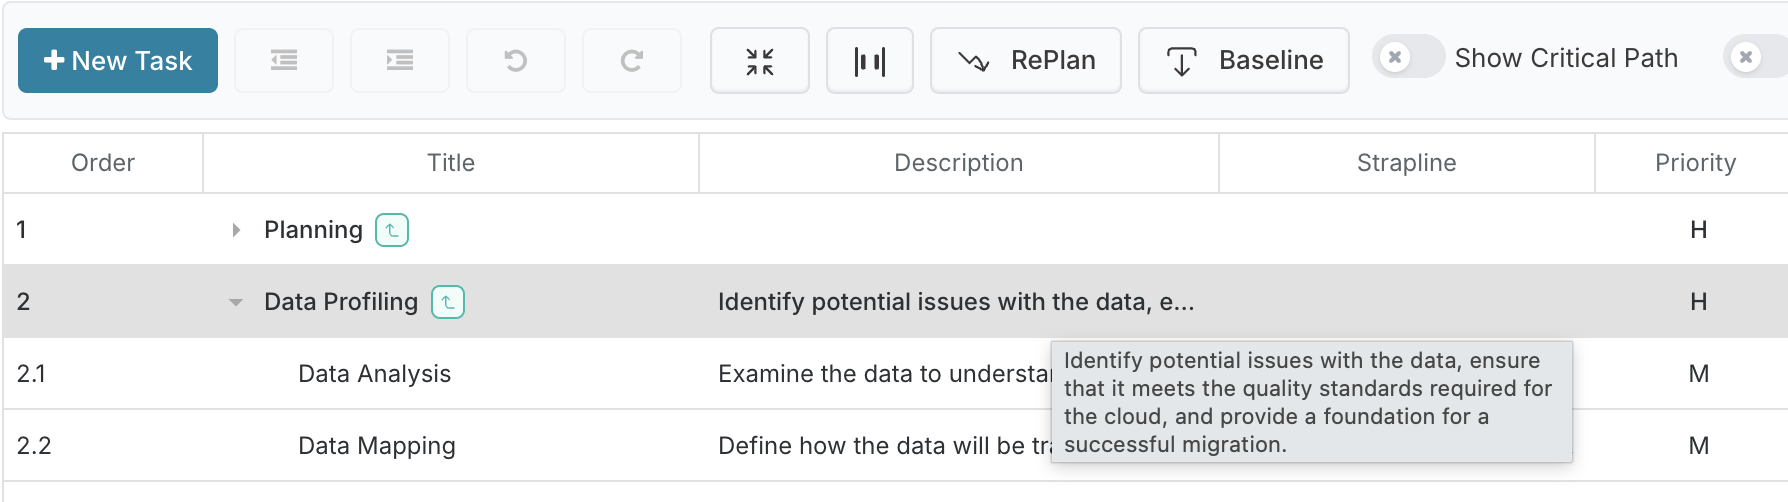
New Columns for Improved Context
Description Column: Displays the task’s Description directly in the grid, making it easier to scan key details at a glance. Hover over the cell to view the full text.
RAG Strapline Column: Surfaces the latest status-update strapline for each task so you can quickly understand current progress. Hover to see the full message.
Priority Column: Shows each task’s priority and supports sorting to help you focus on the most important items. A new Show High Priority Items filter option has also been added.
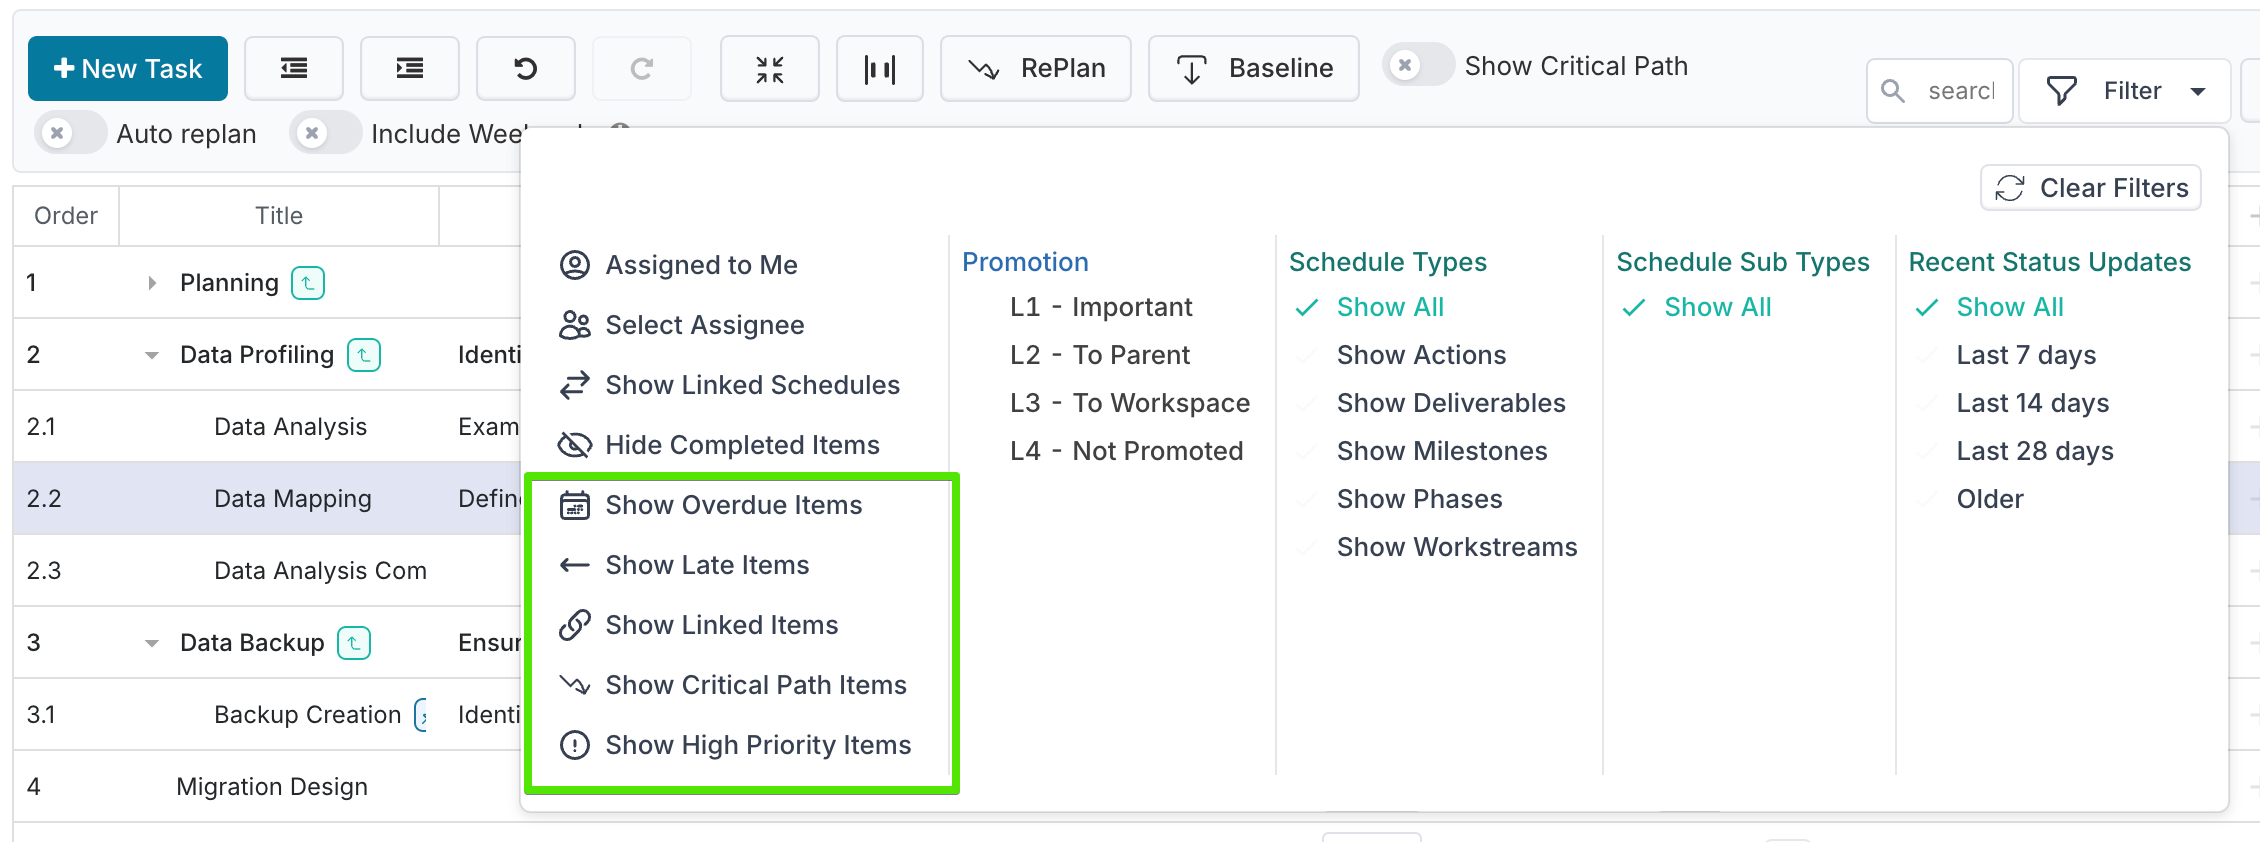
Enhanced Filters (Gantt & Grid)
The Schedule filter menu now includes several additional options that help you focus on the tasks that need the most attention:
Show Overdue Items: Highlights tasks whose end date has passed and are not yet complete.
Show Late Items: Identifies tasks that are slipping against their planned timeline but have not yet reached their end date.
Show Linked Items: Displays tasks that are linked to board tasks, where the task’s progress and completion percentage are driven by the underlying board item. This makes it easier to identify schedule tasks whose status is controlled outside the Gantt and reflects activity recorded directly on the board.
Show High Priority Items: Surfaces tasks marked as High priority so you can focus on the most important activities.
Critical Path Filter: Highlights tasks on the critical path.
You can turn on multiple filters at the same time to tailor the view to the specific tasks you need to review.
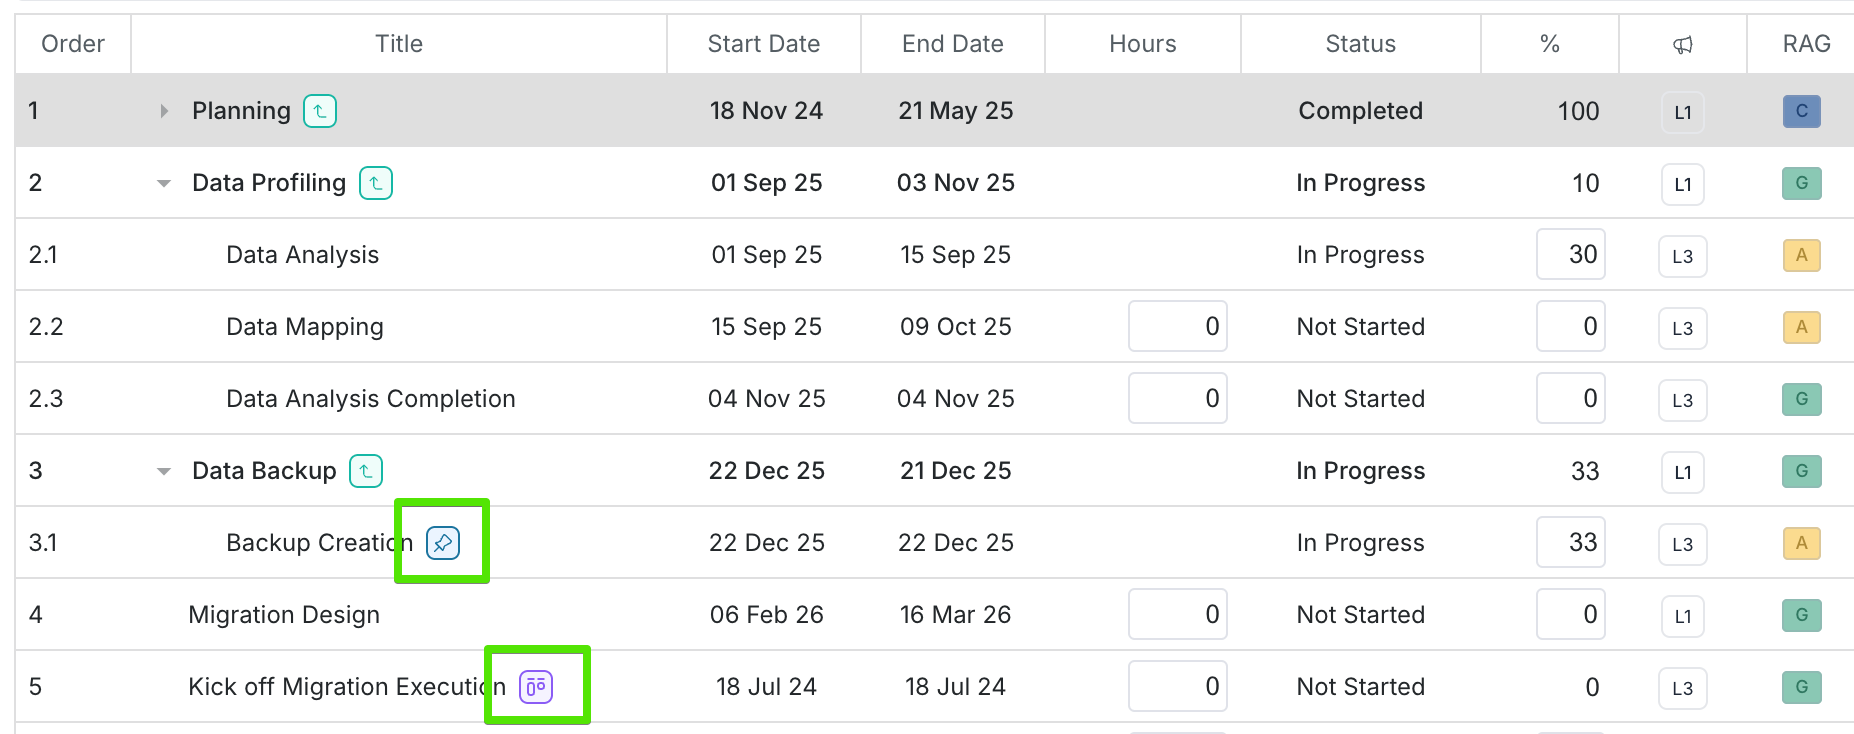
Linked & Pinned Task Indicators
Tasks that are pinned or linked now surface clearer visual cues:
Icons appear next to the task title.
Manually scheduled tasks display a blue shadow on the timeline to highlight they are pinned.
Linked tasks show a purple link icon to indicate the task is driven by an underlying board item.
Visual cues for overdue, late, and linked tasks have been improved across both grid and Gantt views for consistency and readability.
Gantt Schedule State Retention
The task hierarchy (open or collapsed groups) is now remembered automatically. After expanding or collapsing items, moving to another project and returning will restore the same hierarchy as before. This makes it easier to pick up where the review was left off, particularly in larger schedules.
Other enhancements
Visual cues for overdue and late have been improved across both grid and Gantt views for consistency and readability.
Cross-project items are now easier to identify on the timeline. A dedicated label marker now highlights where a cross-project item begins, replacing the previous vertical bar indicator.
2. Project Notifications
We’ve introduced a new set of automated Project Notifications designed to keep Primary Project Managers up to date with important changes to the projects they manage. These notifications are sent by email and through your in-app personal bot, ensuring you never miss a critical update.
When enabled, the application now sends notifications for key lifecycle events. These cover:
Project Created – A new project has been set up
Primary PM Added – You’ve been assigned as a Primary PM
Primary PM Removed – You are no longer a Primary PM for a given project
Status Changed – The project status has been updated
Notifications are sent to:
Active Primary Project Managers
Project Editors (if the “Project Editor Notifications” option is enabled)
Please note that you won't receive a notification if you've initiated the change.
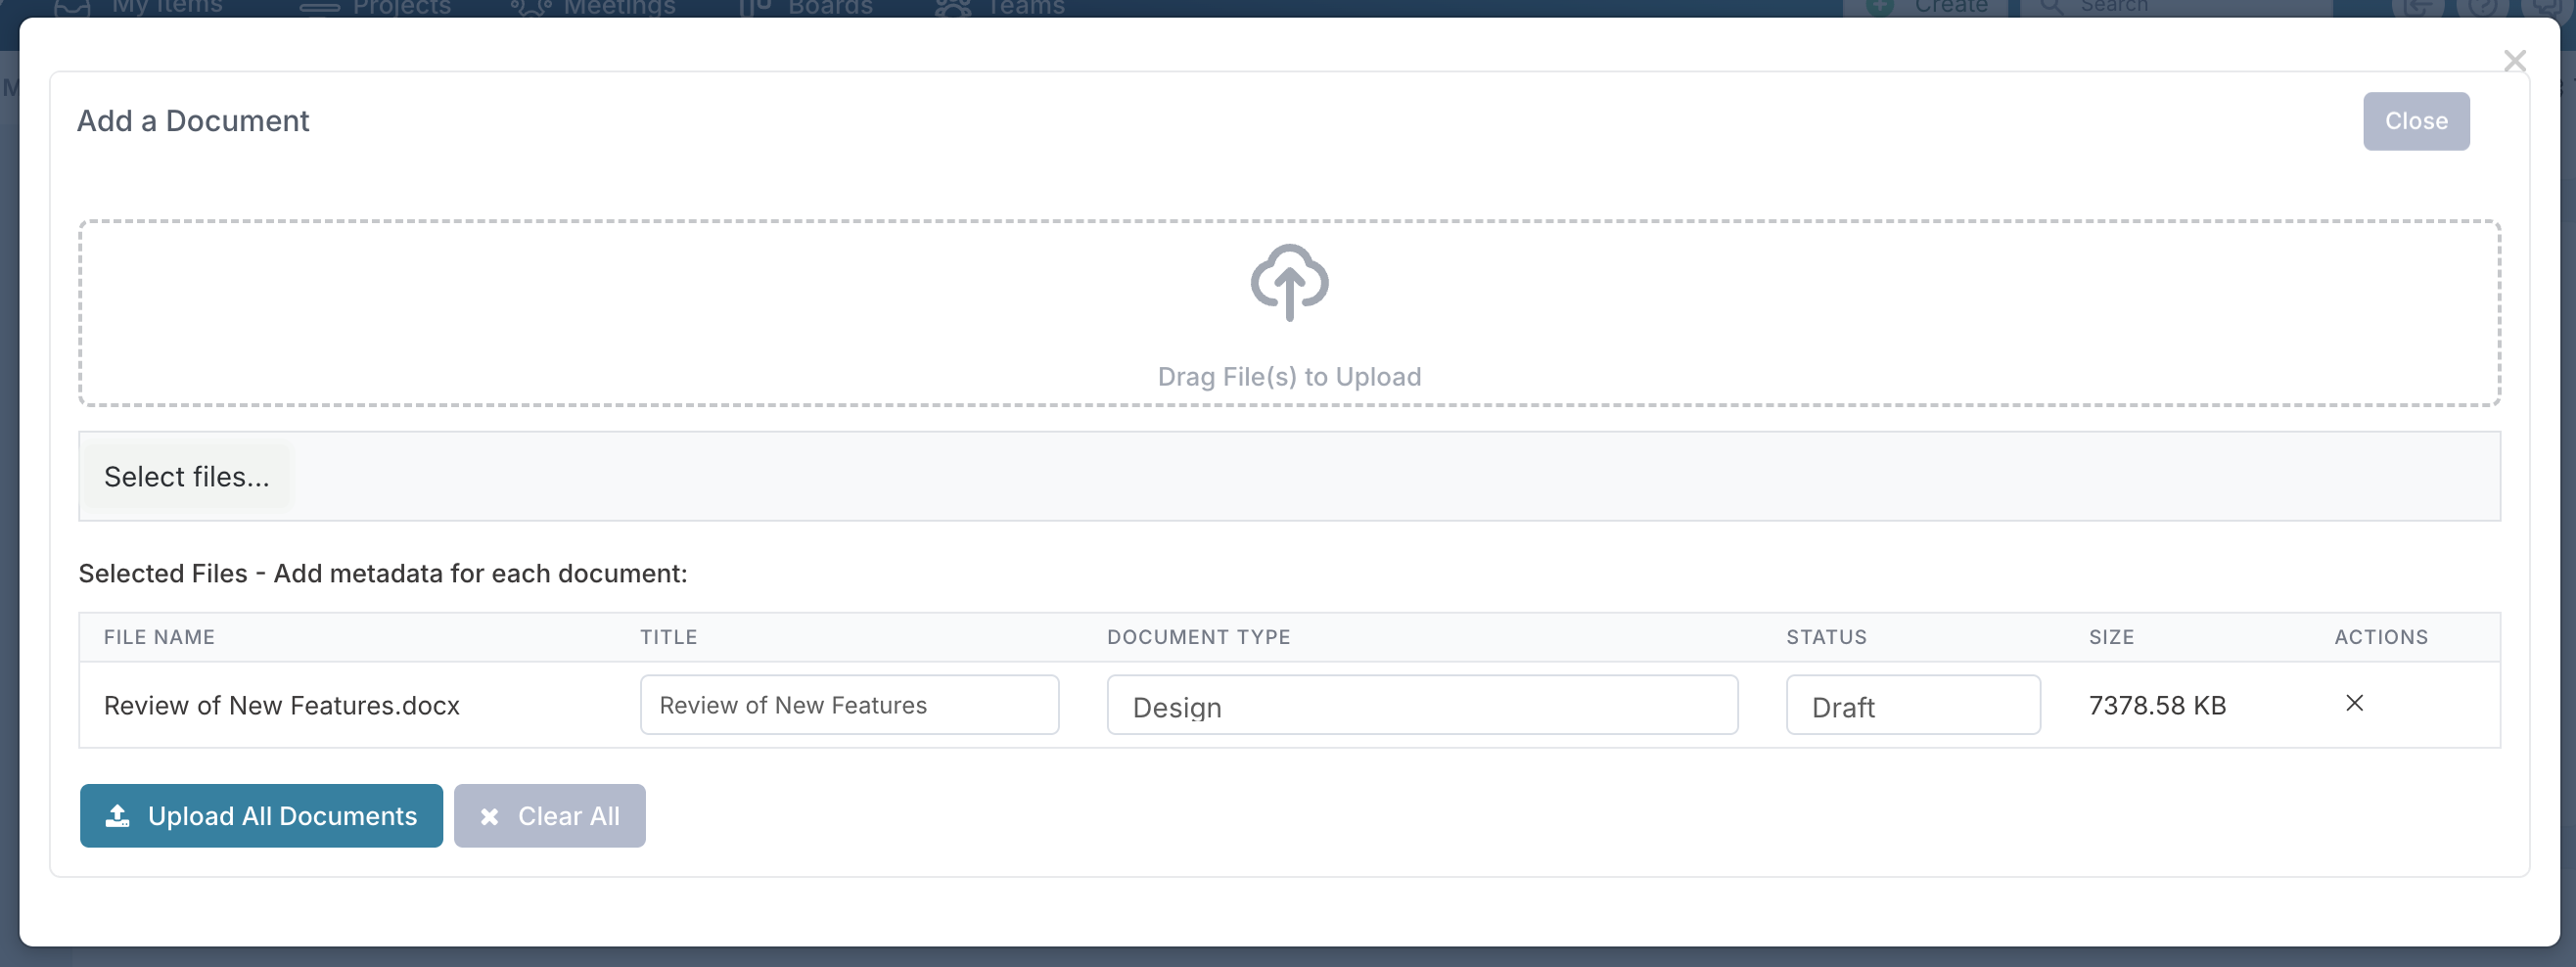
3. Document Upload
You can now set the title, document type, and document status at the point of upload, removing the need to edit the document afterwards. This streamlines document management and ensures files are correctly classified as soon as they are added.
4. Project Property labels
We’ve expanded the set of project property names you can customise. You can now rename Description, Requirements, Project Type, Category, and Funding Source directly from the Project Labels & Field Names page, giving you even more flexibility to tailor Fluid to your organisation’s terminology and reporting standards.
5. Timesheets
The application can now be configured to allow users with the Project Viewer role to submit timesheets on behalf of a timekeeper. This is particularly useful for scenarios where timesheet delegates or project coordinators need to assist with time entry, ensuring time can still be submitted when a user is unavailable.
Enhancements & Fixes
Project Dashboards: You can now use Valued Option project properties when configuring pie charts, allowing you to visualise weighted values directly in dashboard chart