Create a Report with Multiple Project Lists
Overview
The [PROJECTS] command lets you pull a list of projects into a report template, one project per table row, with control over which projects appear, how they are sorted, and how many rows to show.
Use it when you need to report across multiple projects in a single table, rather than on one project at a time.
How to Use the [PROJECTS] Command
Add [PROJECTS] to the first row of your table beneath the header row. Immediately after it, with no spaces between, add a binding to pull in a project field.
Template:

When exported, this expands into one row per project from your Dashboard Watchlist:
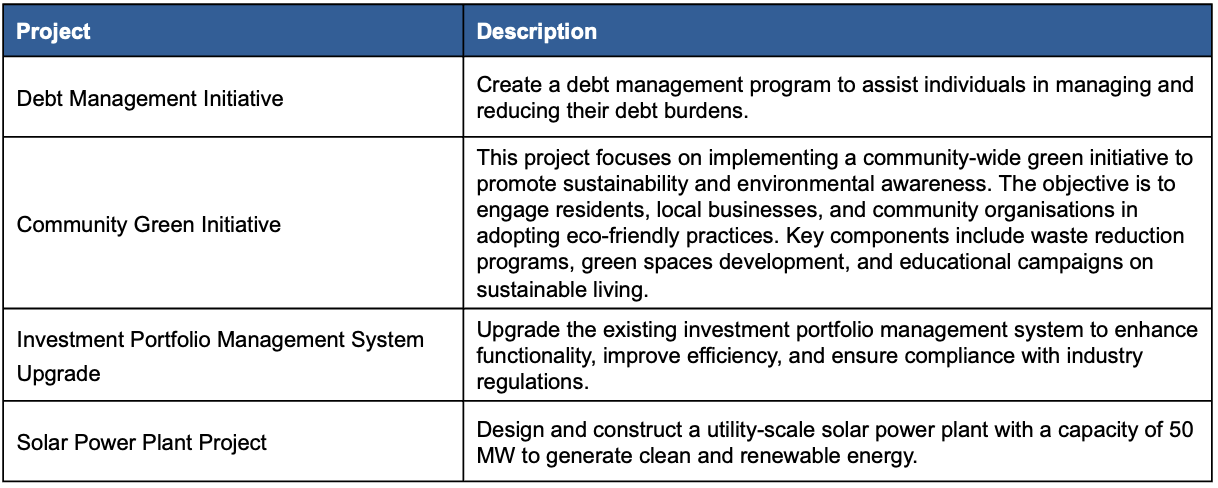
Note: If you do not add a binding element in the cell with [Projects], the table will still work, but that first column will be blank for each project row.
Each table with [PROJECTS] is independent, so you can include multiple project lists in the same report with different filters or sorting.
Filtering Project Lists
By default, [PROJECTS] pulls everything from your Watchlist. Add a filter immediately after the command to narrow it down.
Syntax
[Projects][^Type=Project.PropertyName&&PropertyName=Condition]
Syntax Rule | Example |
[^ ] | [^ ] |
No space between | [PROJECTS][^ ] |
Always prefix the property with | [^Project.PropertyName] |
Add the condition after | [^Project.PropertyName=Condition] |
Multiple values: comma-separated, no spaces | [^Project.PropertyName=Condition 1,Condition 2] |
Multiple properties: separated by | [^Project.PropertyName=Condition&&Project.PropertyName=Condition] |
Single filter
[PROJECTS][^Project.Status=Active]
Shows only projects where Status is Active.
Multiple conditions for one property
[PROJECTS][^Project.Status=Active,Closed]
Shows projects where Status is Active or Closed. Separate values with a comma, no space.
Multiple properties
[PROJECTS][^Project.Status=Active&&Project.Category=Change Initiative]
Shows projects where Status is Active and Category is Change Initiative. Separate properties with &&.
Limiting the number of rows
Add [Rows(n)] after your filter to cap how many projects appear.
[PROJECTS][^Project.Status=Active][Rows(5)]{Project.Name}
Filters are applied first, then the row limit kicks in - so you get the first n projects that match the filter.
Sorting Projects
Use [SORTBY(Project.PropertyName)] to control the order projects appear in.
Ascending
For most of the properties, ascending is the default order - some dates may be an exception where you do need to declare 'Asc'.
[PROJECTS][^Project.Status=Active][SORTBY(Project.Name)]{Project.Name}
Alphabetical by project name, A to Z.
OR
[PROJECTS][^Project.Status=Active][SORTBY(Project.EndDate Asc)]{Project.Name}
By project end date, oldest to newest.
Descending
[PROJECTS][^Project.Status=Active][SORTBY(Project.StartDate Desc)]{Project.Name}
Most recently started projects appear first. Add Desc after the property name with a space.
Sort by Multiple Properties
[PROJECTS][^Project.Status=Active][SORTBY(Activity.Name Desc,Title Asc)]{Project.Name}
Active projects listed in descending order by activity name, then ascending order by title.
Putting it all together
Here is a report template with two independent project tables.
Active projects, sorted by start date, newest first
Project | Owner | Start Date |
|---|---|---|
[PROJECTS][^Project.Status=Active][SORTBY(Project.StartDate Desc)]{Project.Name} | {Project.Owner} | {Project.StartDate} |
Recently closed, last 3
Project | Close Date |
|---|---|
[PROJECTS][^Project.Status=Closed][SORTBY(Project.EndDate Desc)][Rows(3)]{Project.Name} | {Project.EndDate} |
Both tables live in the same template and generate independently when the report is exported.
Worked Examples
Below are a list of practical examples. You can find files attached at the bottom of this KB which you can download, edit and upload to Fluid to create your own report templates. For information on how you can upload these templates to Fluid, click here.
Project Status Report by Portfolio
This example will show you how to create on report with a table for each portfolio, with a list of projects, detailing their progress and status.
Download a copy of this example from the bottom of this article: Project-Status Report-by-Portfolio.pptx
Example:
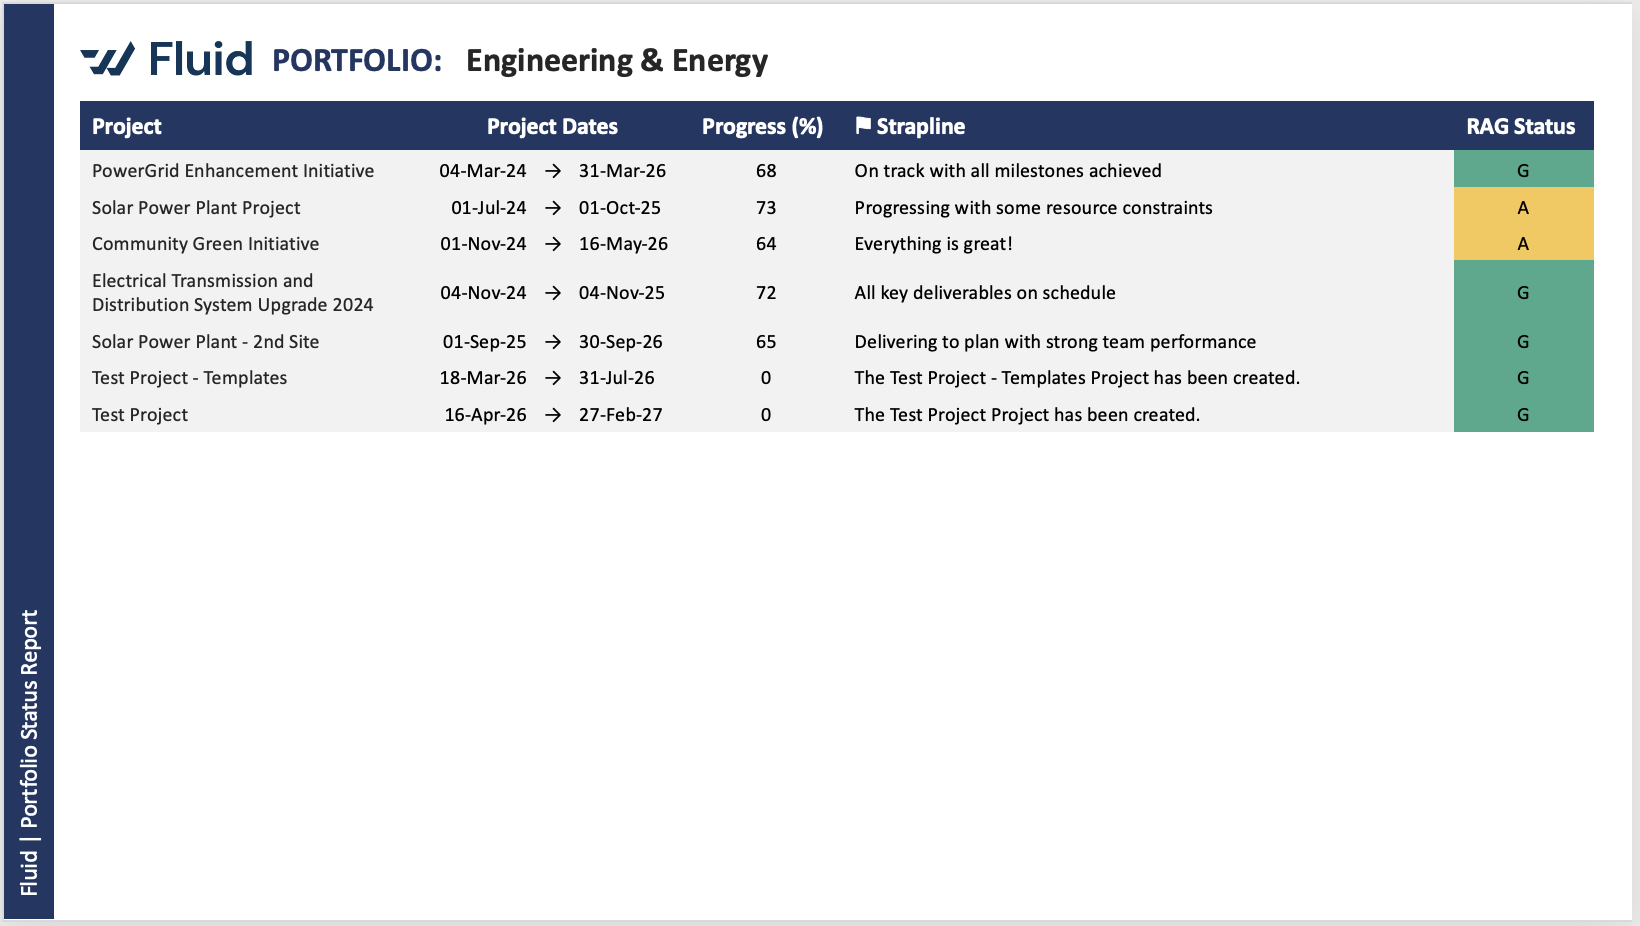
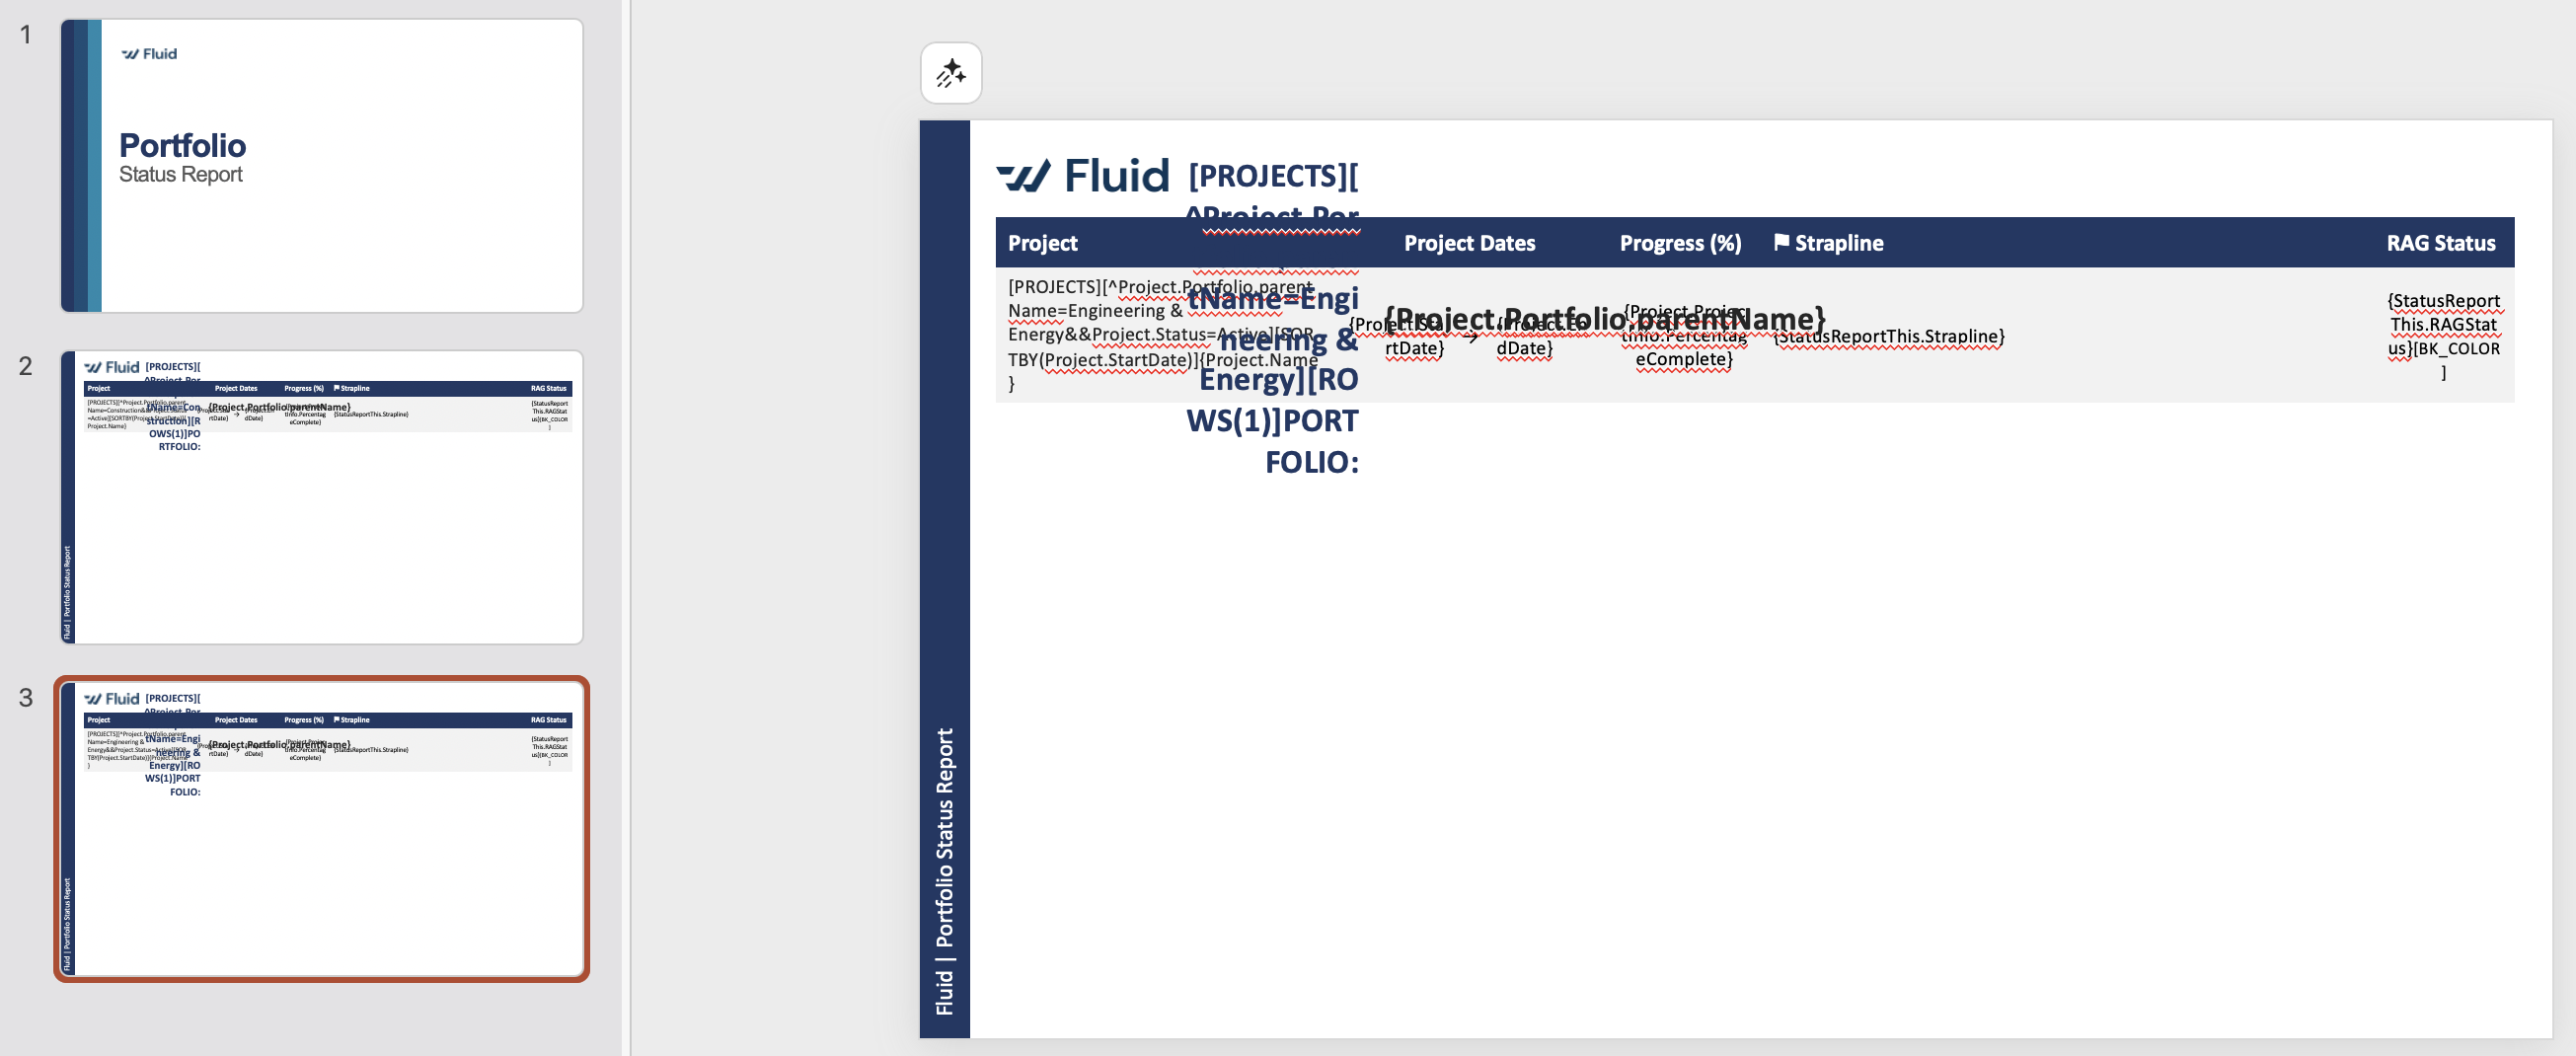
1. Create the Table
To recreate this, you will need to create a table in Word or PowerPoint similar to the below:

Note: You can style your table however you choose. This example starts with a table that is 7 columns and 2 rows. The cells in columns 2, 3 and 4 or row 1 are merged to create one title filed over 3 project date fields; the middle field contains an arrow symbol. The Strapline flag is also a symbol. All text has been vertically centred.
The binding elements you need are:
Project list command, filter, sort and project name. | [PROJECTS][^Project.Portfolio.parentName=Construction&&Project.Status=Active][SORTBY(Project.StartDate)]{Project.Name} | Important! You will need to replace the Portfolio name with your own portfolio name and if you have a different status for Active projects or even multiple status, you will need to amend the condition here too. |
Project Start Date | {Project.StartDate} | Copy and paste. |
Arrow Symbol | → | Copy and paste into the middle cell between the start date and end date. |
Project End Date | {Project.EndDate} | Copy and paste. |
Project Percentage Complete | {Project.ProjectInfo.PercentageComplete} | Copy and paste. |
Status Strapline | {StatusReportThis.Strapline} | Copy and paste. |
Flag Symbol | ⚑ Strapline | Copy and paste into the Strapline column header filed. |
RAG Status | {StatusReportThis.RAGStatus}[BK_COLOR] | Copy and paste. Remove [BK_COLOR] if you don't want the cell background colour. |
Add the column headers and binding elements to the table as per the template example image above.
You can then style your table in Word or PowerPoint, changing the font, font colour, alignment, the table background colours and the border colours. The example has no border.
2. Add the Portfolio Name as a Page Title
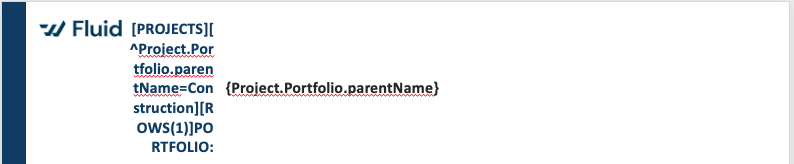
To add the portfolio name as the page header, add another table the is one row by 2 columns. Add the following:
[PROJECTS][^Project.Portfolio.parentName=Construction][ROWS(1)]PORTFOLIO: | {Project.Portfolio.parentName} |
It will look a bit odd in the Word or Powerpoint file as the binding element is quite long, but when rendered in the exported report, only the text 'Portfolio:' and the Portfolio name will show.
Example:
3. Style the Report Pages
In this example, you can see that a logo image has been added and a shape, with text down the side using a simple shape and rotating the direction of the text. Consider your table widths; the content generated may not be as long as the binding element in the template. It's worth uploading your template and exporting with a limited number of projects just to check the layout.
4. Add a Second Portfolio Table
Now that you have your first table all set up, make a copy of the page in the same document, and change the portfolio name in both the page title table which contains the portfolio name and the table containing the projects list with the project progress and status details.
If using MS PowerPoint, you can have multiple tables on one page, or you can create a new page for each Portfolio project list, but keep in mind that unlike MS Word, when content is longer than the page, a new page will not be automatically created and content may overlap or overhang requiring some manual changes after export. Consider the length of the tables that will be generated when setting up your template.
This is what the finished template looks like with a cover page and two portfolio project status report lists, one per page.