User roles: ✔ Project Manager ✔ Benefit Owner ✔ Benefit Administrator
Benefits are usually agreed at the start of a project and forgotten by the end of it. Results arrive months after go-live, long after the team has moved on, so nobody records them, nobody chases them, and the portfolio's benefits report becomes a list of forecasts that were never checked.
Fluid keeps benefits reported on. Project managers record what each benefit delivered, the results of its KPIs and how confident they are it will land. Reminders chase anything overdue, and the benefits dashboards show, across every project, what was promised, what has arrived, and what has not been reported yet.
In this article you will learn how to set up confidence reporting and reminders, how project managers record realized values, KPI results and confidence, how Fluid reads the numbers, and which dashboard answers which question.
Before You Start
The settings in steps 1 and 2 need the Benefit Administrator role, on Administration Console → Benefits → Benefits Administration.
Confidence reporting needs the Enable Benefit Confidence Reporting feature; KPI results and reminders need Show Benefit KPI Tracking. See Benefits Framework: Getting Started.
Realized values can be recorded once a benefit is approved or baselined. See Setting Up Benefit Baselines and Approval.
What Gets Reported, and How Often
What | Recorded by | How often |
Realized values: the money a quantitative benefit delivered | The project manager | At the benefit's Financial Impact Cadence |
KPI results | The project manager, or the KPI's owner | At each KPI's own Cadence |
Confidence that the benefit will be realised | The project manager | At the organisation's Review cadence |
Benefit owners answer for their benefits. They are copied on reminders to report, and they appear by name on the reporting compliance figures.
Step 1: Set Up Confidence and Impact
This step needs the Enable Benefit Confidence Reporting feature. Use the Benefit Confidence & Impact panel of Benefits Administration.
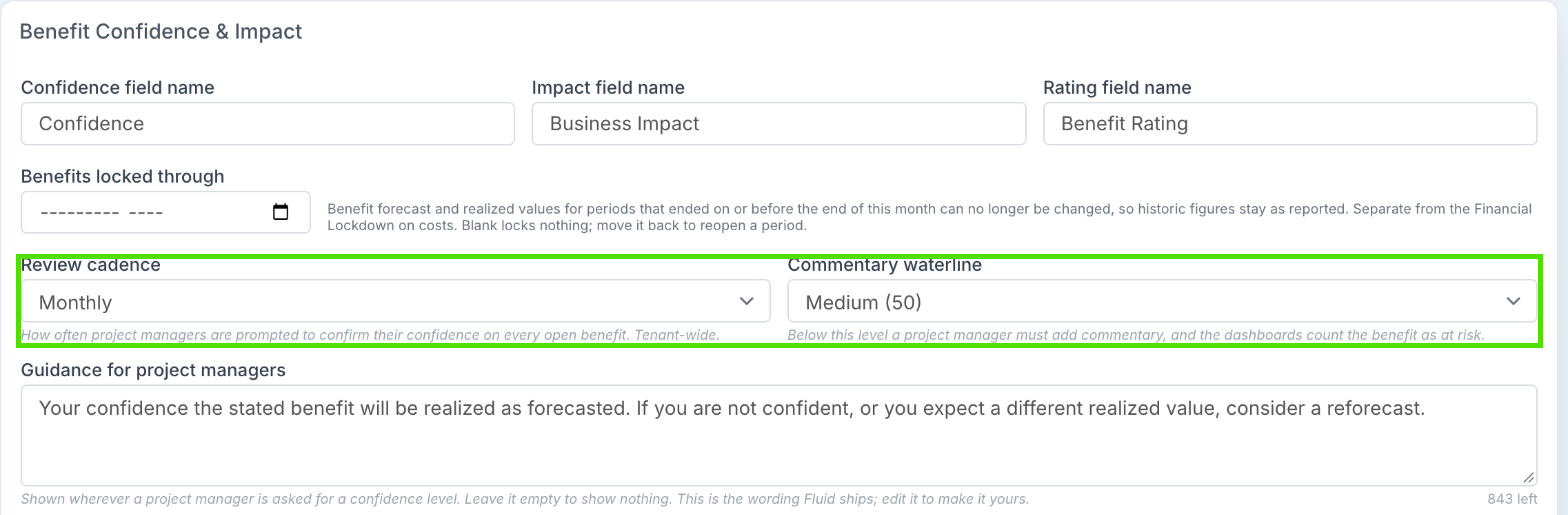
Setting | What it does |
Confidence field name, Impact field name, Rating field name | What the three scales are called on screen. The standard names are Confidence, Business Impact and Benefit Rating. |
Benefits locked through | Forecast and realized values for periods that ended on or before the end of this month can no longer be changed, so historic figures stay as reported. Leave it blank to lock nothing; move it back to reopen a period. |
Review cadence | How often project managers are asked to confirm their confidence on every open benefit: Monthly, Quarterly or Annual. |
Commentary waterline | Below this confidence level a project manager must add commentary, and the dashboards count the benefit as at risk. Choose No waterline to turn this off. |
Guidance for project managers | Shown wherever a project manager is asked for confidence. Explain what confidence means for you, and what to do when it is low. |
Confidence scale | The levels a project manager picks from, such as Very Low (10) to Very High (90). A higher weight means more confident. |
Business Impact scale | The size of a benefit, such as XS to XL. Leave it empty to rate on confidence alone. |
Benefit Rating scale | Bands that combine impact and confidence into a benefit's overall standing. Choose the Function (Multiply, Sum or Average) and the weight at which each band starts. |
Each option on a scale has its own Guidance, shown under it in the picker, and one option on the confidence and impact scales can be the Default.
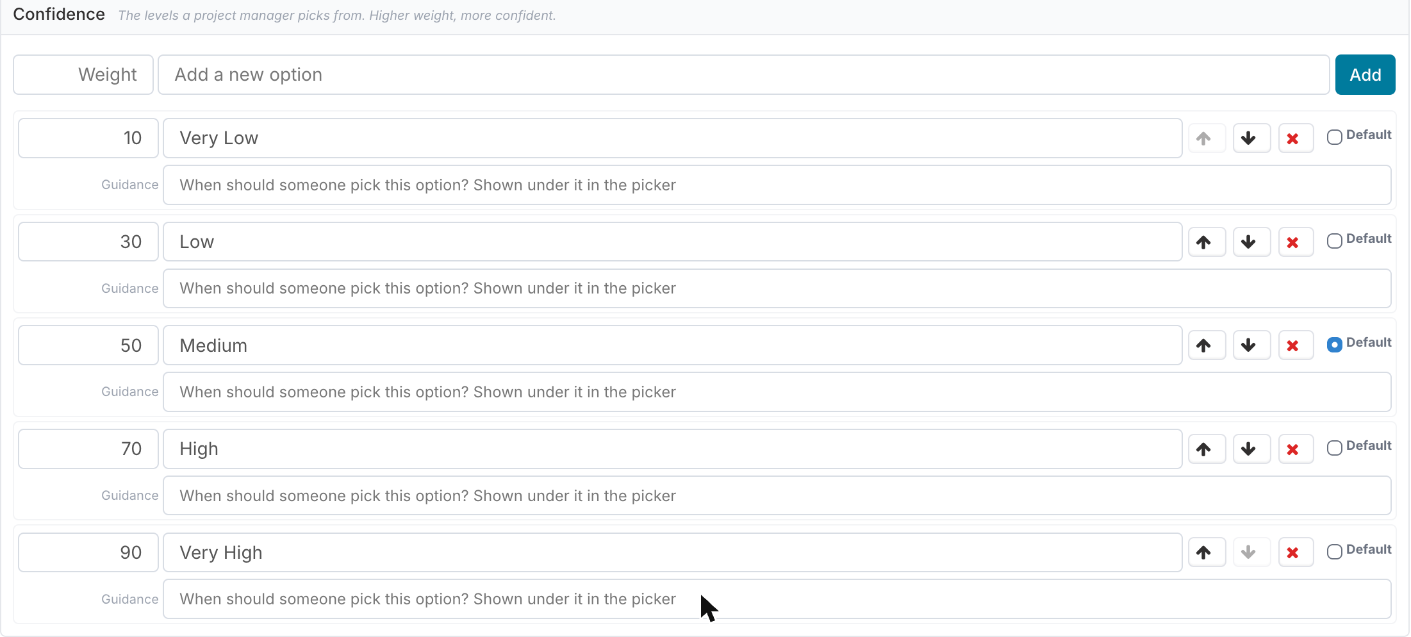
Click Save at the top of the page. Changing the rating bands or function re-rates each benefit the next time it is saved or reviewed, not all at once.
In the example, the waterline is Medium (50): a benefit reported at Low or Very Low needs a reason, and shows as at risk until confidence recovers.
Step 2: Set Up Reporting Reminders
Fluid reminds people to report each KPI result that is due, timed from the end of the KPI's reporting period. Set the timings on the Reporting Reminders panel:
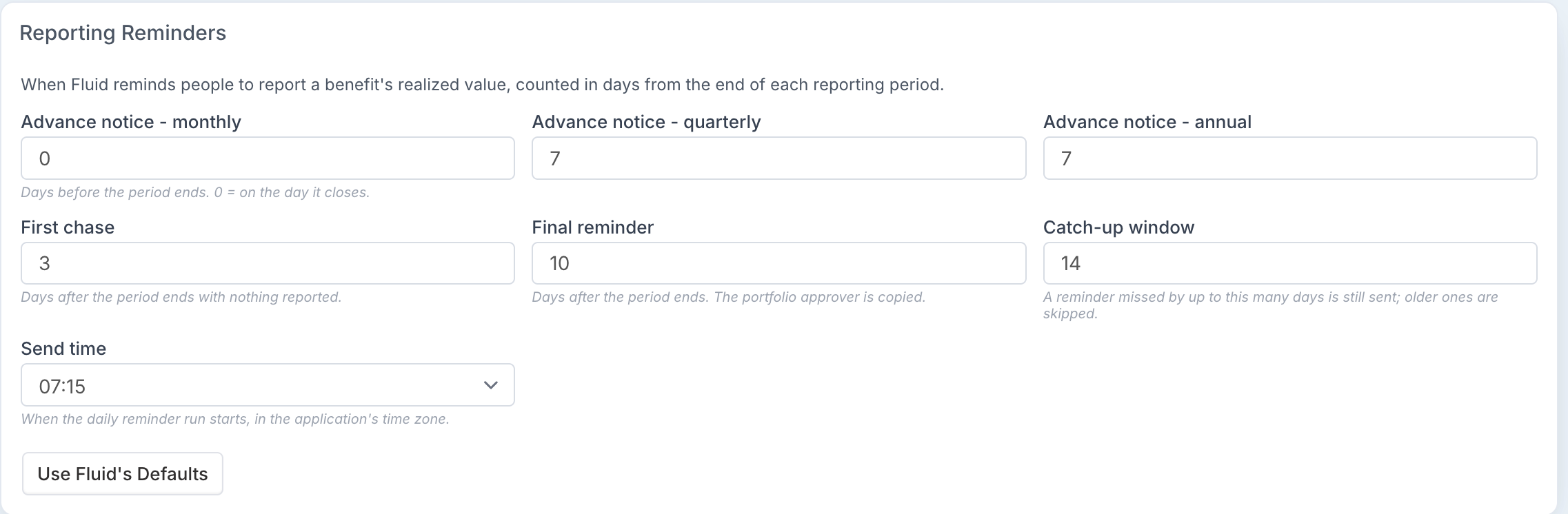
Setting | Default | Meaning |
Advance notice - monthly | 0 | Days before a monthly period ends. 0 sends it on the day the period closes. |
Advance notice - quarterly | 7 | Days before a quarterly period ends. |
Advance notice - annual | 7 | Days before an annual period ends. |
First chase | 3 | Days after the period ends with nothing reported. |
Final reminder | 10 | Days after the period ends. The benefit's approver is copied. |
Catch-up window | 14 | A reminder missed by up to this many days is still sent; older ones are skipped. |
Send time | When the daily reminder run starts, in the application's time zone. |
Click Use Fluid's Defaults to put the standard timings back.
Who receives reminders is set by two features: Send Benefit Notifications to the Project Manager and Send Benefit Notifications to the Benefit Owner. With both off, no reminders are sent. With Show Benefit Owner off, none go to owners.
A period gets at most three reminders: the advance notice, the first chase and the final reminder.
Each person receives one email listing all their benefits, not one email per benefit.
The confidence review prompt goes to the project manager, one email per project per review period, listing the benefits still to review.
Anyone without the Benefit access role is skipped. Reminders only run while Show Benefit KPI Tracking is on.
Step 3: Record Realized Values
Open the benefit and go to Financial Impact. In the Value section, the By Period table has a column for each period at the benefit's cadence. Enter what the benefit delivered in the Realized row. The Variance row then compares it with the Approved Baseline, or with the forecast if the benefit has no baseline.
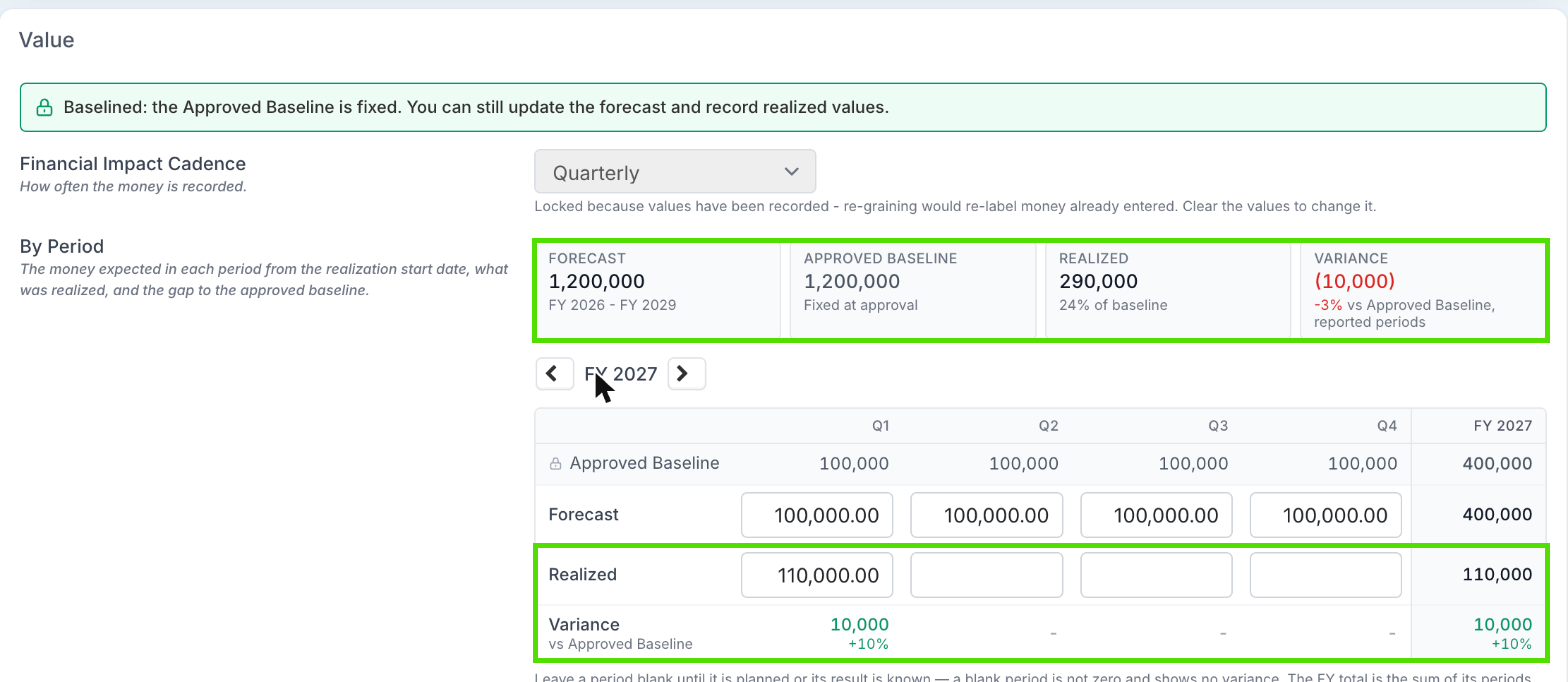
The Realized and Variance rows appear once the benefit is approved or baselined.
Leave a period blank until its result is known. A blank period never counts as zero and shows no variance.
Recording the first realized value fixes the benefit's realisation start date.
Benefits say Realized where costs say Actual, so value delivered never reads as money spent.
Where realization approval applies, realized values are submitted for approval and approved periods lock. See Approving Realized Values.
Step 4: Record KPI Results
Open the benefit and go to KPIs.
Click Edit on the KPI.
In Measurements, use the financial year arrows to find the period, and enter the result in the Actual row.
Click OK, then save the benefit.
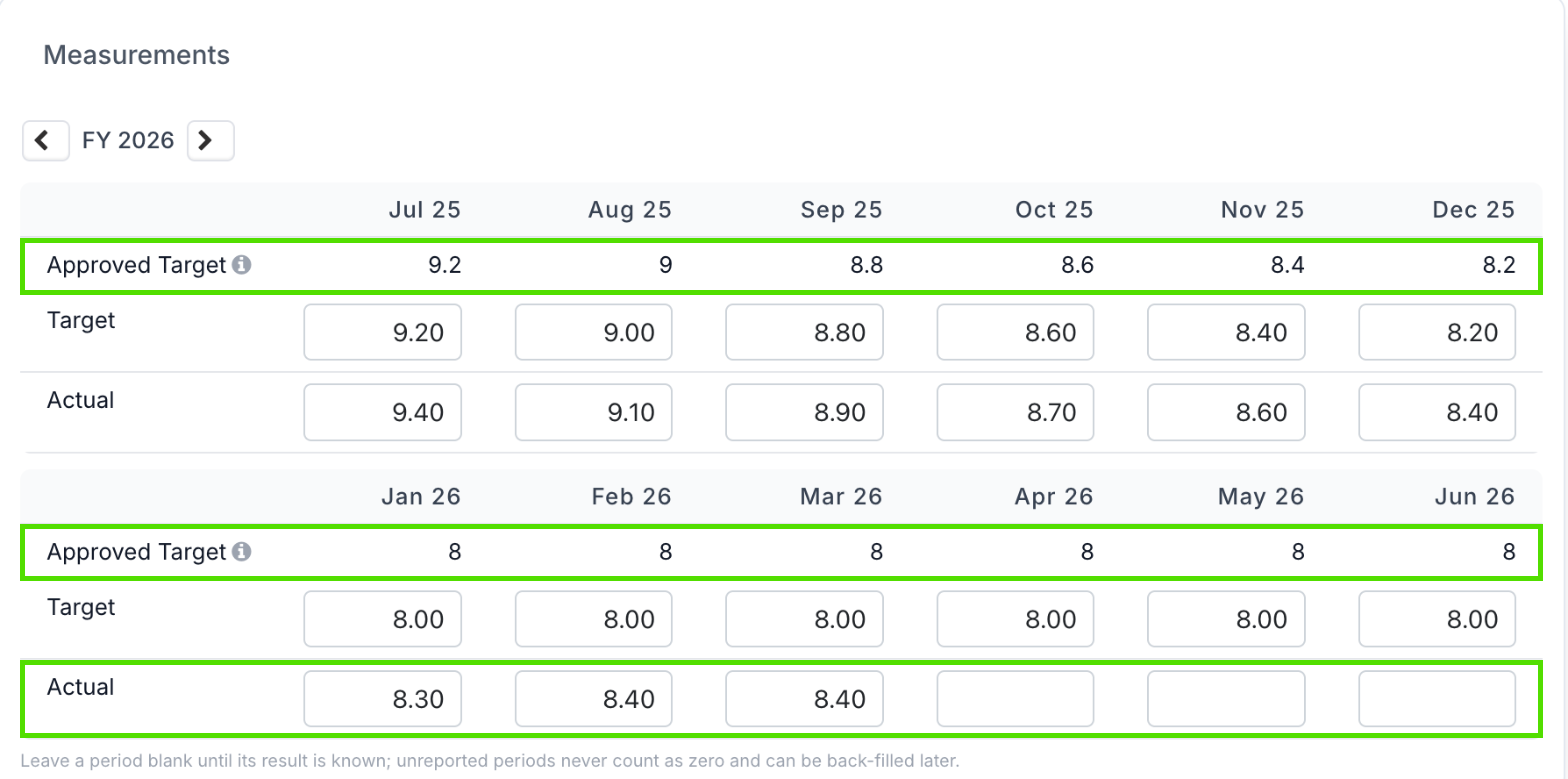
The KPI's row then shows its realisation percentage, coloured green, amber or red, and how the result compares with its starting value, for example Improved vs start. Back-filling earlier periods is normal: a period stays unreported until someone fills it in, and the dashboards say so rather than scoring it as zero.
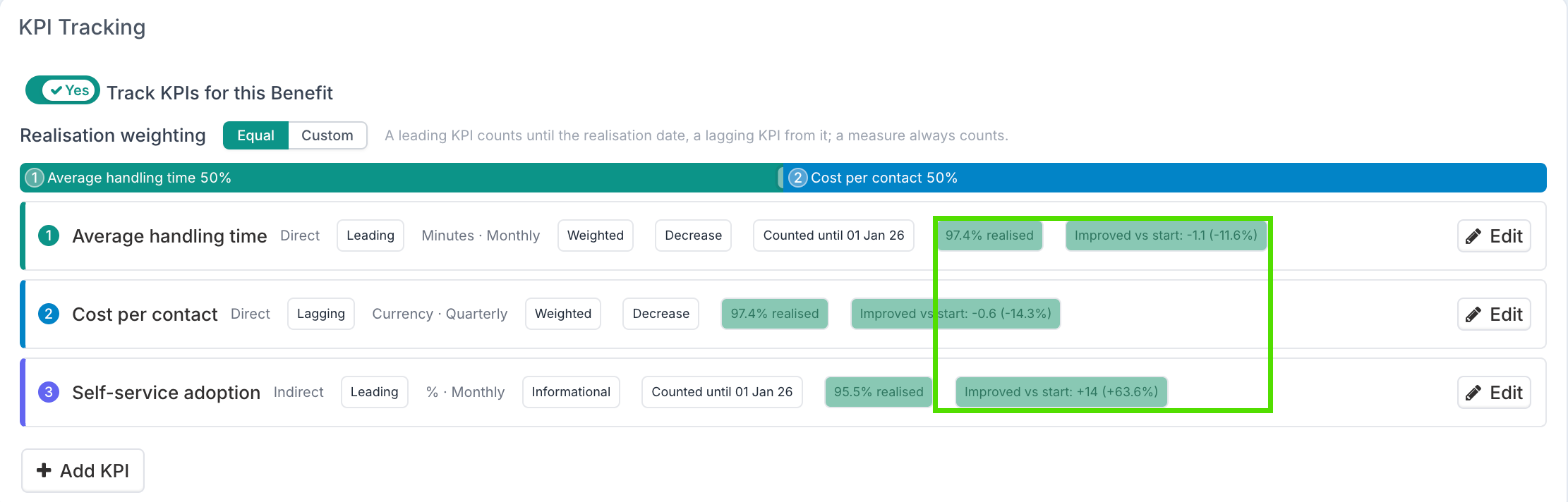
Once the benefit is approved, the grid also shows an Approved Target row: the KPI's targets as they stood at approval. Nobody can edit it, so if a target changes later you can still see what was agreed. KPI results lock when a benefit is Closed or Cancelled.
With Enable Benefit KPI Owners on, a KPI's owner can open the benefit read-only and record that KPI's results with Save actuals, without project permission or the Benefit access role.
Step 5: Review Confidence
Project managers restate their confidence at the review cadence, in either of two places:
On one benefit: the Confidence Updates section shows the current level, an Update button and the dated history.
Across a project: on the project's benefits list, click Review Confidence. Each benefit that can be reviewed gets a picker and a commentary box. Click Save Review to save them together.
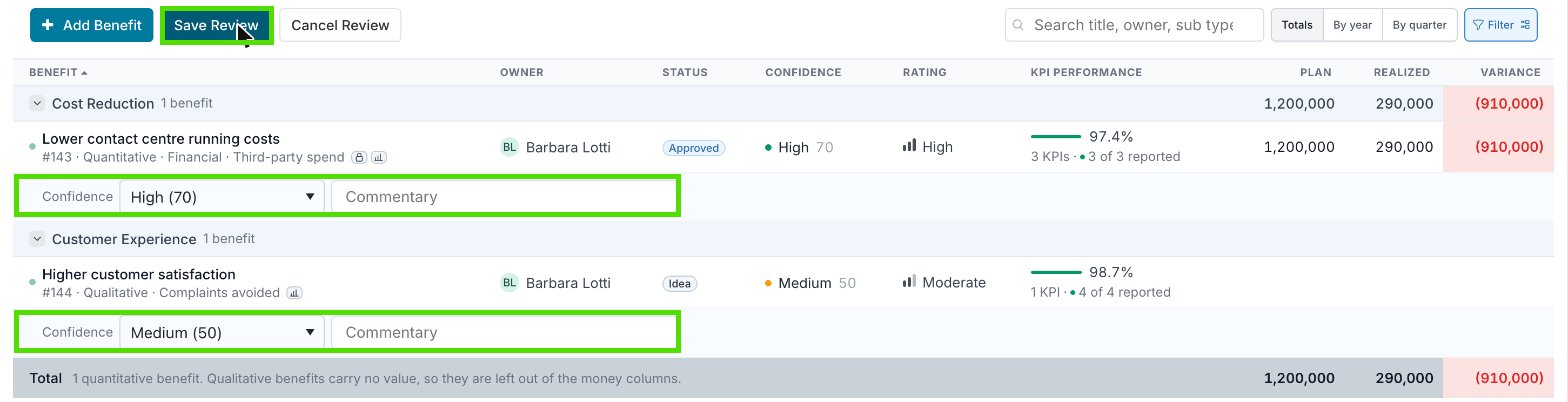
Below the waterline, commentary is required for each benefit, and the review cannot be saved without it. A realised benefit reads as full confidence and is not reviewed; nor are closed, cancelled or archived benefits.
Update Many Benefits at Once
To update forecasts and realized values for many benefits, use the Excel workbook: Bulk Edit from the Tools menu of a project's benefits list, or Bulk Edit Benefits in Benefits Administration (Benefit Administrators, across all projects). Export it, edit the Forecast tab (one row per benefit and period, with Forecast and Realized columns), upload it, check the preview, then apply.
A blank Realized cell means not reported; a 0 is a reported zero. Realized values are never deleted from the workbook.
A benefit changed in Fluid after you exported is refused, unless you tick Overwrite when uploading.
Archived benefits are not in the export, and a row naming one is refused. Unarchive it to bring it back in.
KPI results are not in the workbook; record them on the benefit.
How Fluid Reads the Numbers
Plan is what results are measured against: a benefit's Approved Baseline where it has one, otherwise its forecast. The word itself can be changed on the Labels and Terms panel.
Unreported is not zero. Realisation percentages use reported periods only, so late reporting never lowers them.
Ended, not reported counts as a shortfall on two dashboards. On Benefits Realization and Benefit Value Variance, a period that has ended with a plan and nothing reported counts in full against the variance, and is shown in its own Ended, Not Reported tile. On the benefit itself and the benefits list, an unreported period shows -.
Realisation follows each KPI's direction, so beating a lower-is-better target reads above 100%. A KPI with no results yet counts as On Track with a blank percentage.
Only KPIs that are counting contribute. A leading KPI counts until the realisation start date and a lagging KPI from it.
Qualitative benefits carry no money. Their money cells are blank, not zero, and they are left out of money totals.
Approved realized values only, where realization approval applies, on the Benefits Executive, Benefits P&L, Payback & ROI, Strategic Objectives and Strategic Pillars dashboards.
Archived benefits do not count. An archived benefit is left out of every roll-up, total and dashboard, and out of the bulk edit export. See Archiving and Unarchiving Benefits.
At risk means confidence below the waterline. A low rating on its own means small or doubtful, not at risk.
Where to Read the Results
On a project
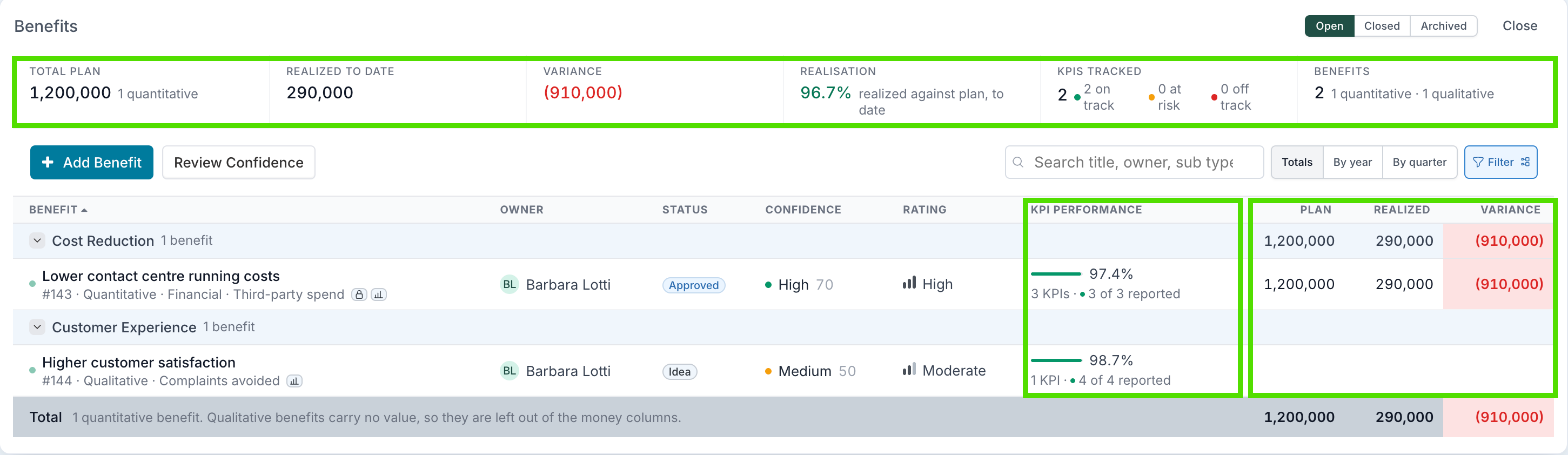
The Benefits section of the project workspace summarises every benefit on the project: tiles for the total plan, realized to date, approvals, confidence and KPIs; a Cumulative Benefit by Quarter chart of realized values against the Approved Baseline and forecast; Where We Are (benefits by status) and the benefit type mix; KPI reporting compliance; the benefits by strategic objective; and a KPI Performance table.
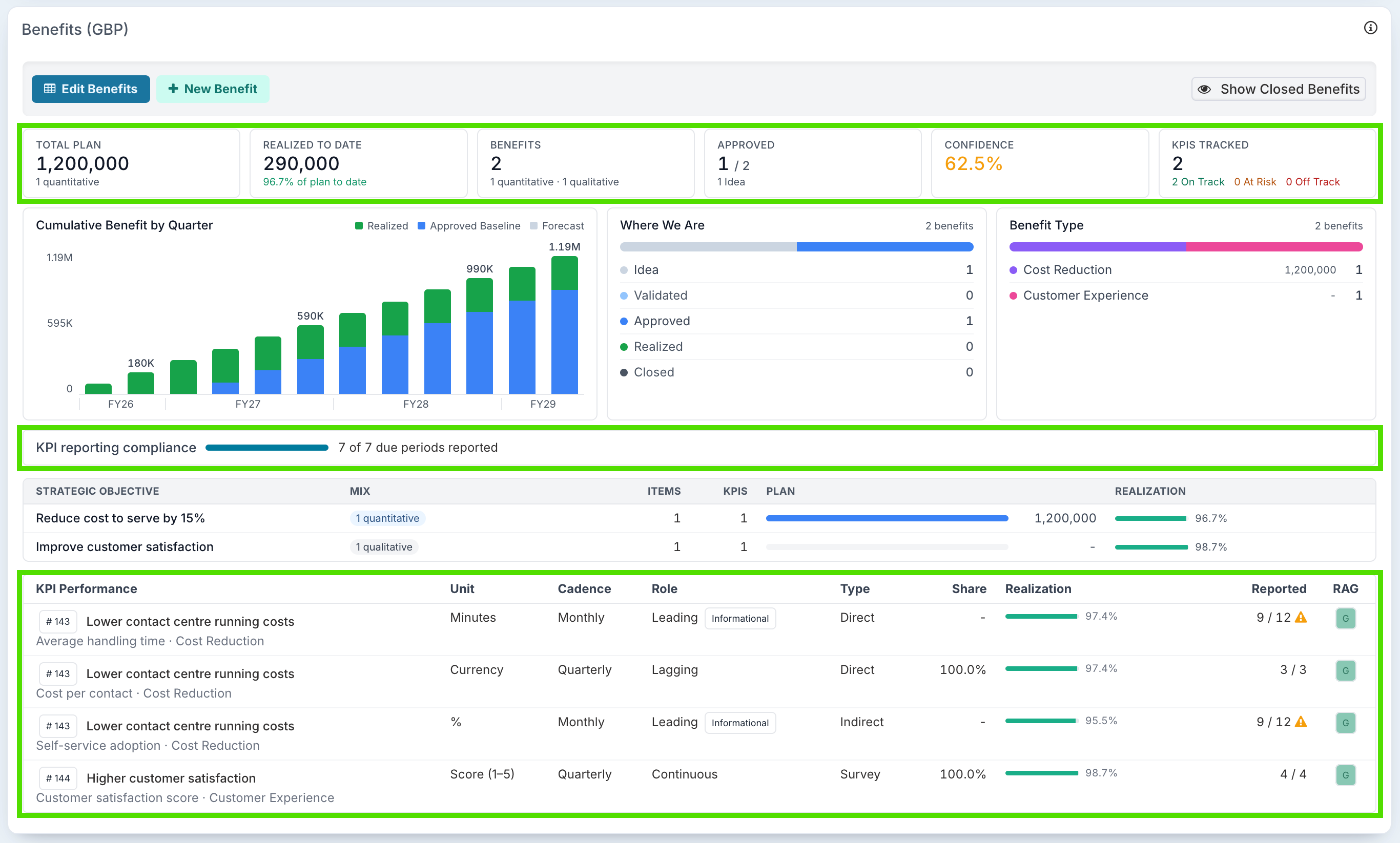
Click Edit Benefits for the project's benefits list. It shows each benefit's status, confidence, rating, KPI Performance (realisation, number of KPIs and how many due periods were reported) and its Plan, Realized and Variance. Switch the money columns between Totals, By year and By quarter; choose Open, Closed or Archived at the top.
Across projects
The benefits dashboards need the Benefit access role. Open a project dashboard, click Switch Report Layout and choose from the Benefits category. The project filters apply, and Save Dashboard keeps the view. See How to create or edit project dashboards.
Question | Dashboard | Look at |
Are we delivering the value we promised? | Benefits Executive | Plan Total, Realized and Realization, and the value bridge: realized, shortfall, unreported and not yet due |
Who owes a number this period? | Benefits Operational | Reporting compliance by owner and by project, and Needs Attention |
Which measures are off track? | Benefits KPI Performance | The KPI Leaderboard. Needs Show Benefit KPI Tracking. |
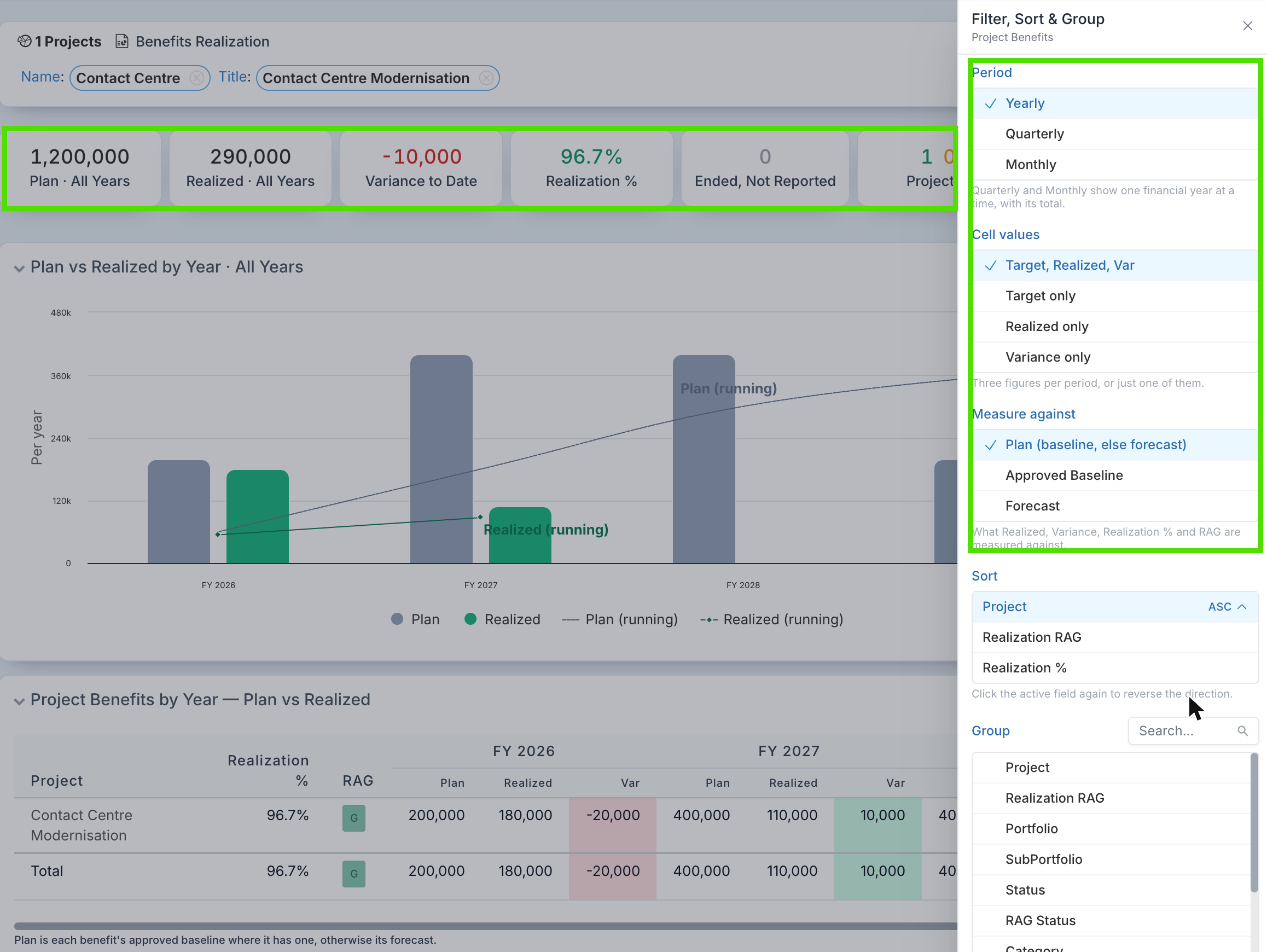
How does realized compare with plan, period by period? | Benefits Realization | Project benefits by year, quarter or month, Plan vs Realized, and Ended, Not Reported |
Did we deliver what was approved? | Benefit Value Variance | Compare realized against Approved Baseline or Forecast |
Do the people running these benefits believe in them? | Benefits Confidence | At Risk, Value at risk, and the confidence × impact heat map. Needs Enable Benefit Confidence Reporting. |
Is the portfolio worth what it costs? | Benefits P&L | Benefits (Plan), One Time Costs, Ongoing Costs, Total Costs, Net (Plan), Net (Realized) and Expected ROI |
When does the investment pay back? | Benefits Payback & ROI | Portfolio Breakeven and ROI to Date |
Are we delivering our strategy, not only our projects? | Strategic Objectives, Strategic Pillars | Combined Target, Forecasted Outcome and Realized, and the row for benefits not aligned to any objective |
Which parts of the organisation deliver value, and which receive it? | Benefit Flows | The provider by receiver matrix. Needs Enable Benefit Target Tracking. |
With KPI tracking off, the dashboards hide their KPI sections. Where a secondary currency is set, every benefits dashboard can switch between the primary and secondary currency.
Period views on the Benefits Realization dashboard
Click Filter on the Project Benefits table to change what it shows:
Period: Yearly, Quarterly or Monthly. Quarterly and Monthly show one financial year at a time.
Cell values: all three figures per period, or just one of them.
Measure against: Plan (baseline, else forecast), Approved Baseline or Forecast. Under Approved Baseline, benefits that have no baseline are left out and counted separately.
Benefit Flows
On Benefit Flows, a provider is the delivering project's own portfolio, and a receiver is where a benefit lands: its Receiving Portfolio, or its project's own portfolio when it has none. Show switches between benefits, one-time costs, ongoing costs and net; Period shows the whole financial year or a single quarter; Level switches between portfolio and sub-portfolio. Click a cell, row or column to break it down by quarter and by project.
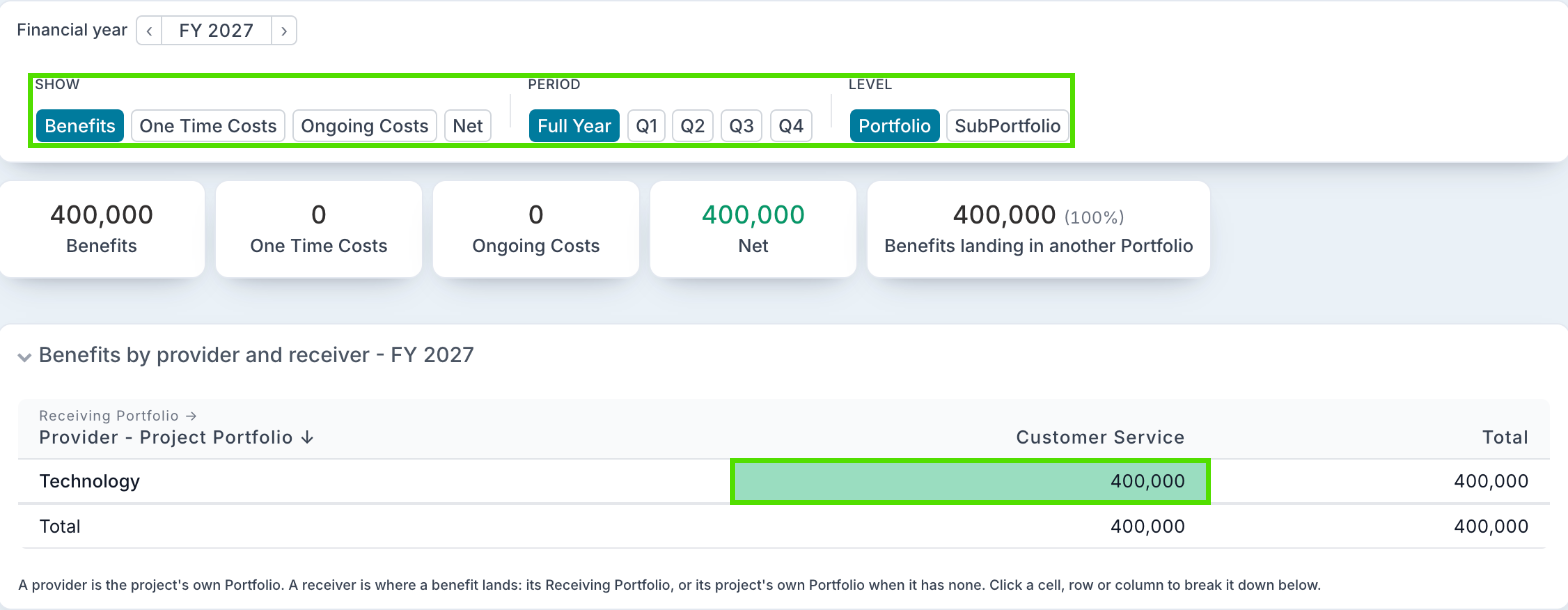
In the example, Contact Centre Modernisation is a Technology project, but the savings land in Customer Service. With the benefit's Receiving Portfolio set to Customer Service, it shows in the Technology row and the Customer Service column. Set the Receiving Portfolio in the benefit's Where It Lands section. Costs have no receiving portfolio, so they stay with their provider.
Excel exports
The Export to Excel page has four benefits reports for people with Benefit access: Benefits Realization by Period, Benefits Realization Summary, Benefits PnL by Period and Benefits PnL Summary.
Good to Know
A benefit's realisation is over 100%.
Check the KPI's Direction. On a Decrease KPI, beating the target reads above 100%.
Project managers are not getting reminders.
Check that Show Benefit KPI Tracking is on; that at least one of the two Send Benefit Notifications features is on; that they have the Benefit access role; and that the benefit has KPI periods with targets that have ended.
Why won't my confidence review save?
A level below the waterline needs commentary. Each benefit missing it is marked.
I cannot see the Benefits dashboards.
They need the Benefit access role. Benefits KPI Performance also needs Show Benefit KPI Tracking, and Benefit Flows needs Enable Benefit Target Tracking.
I can't enter a realized value.
The benefit is not approved or baselined yet, the period is locked by Benefits locked through, or the period has been approved through realization approval.
A benefit is missing from a total, a dashboard or the bulk edit workbook.
Check whether it has been archived. Unarchive it to bring it back. See Archiving and Unarchiving Benefits.
Why does the variance show nothing for a period?
Nothing has been reported for it yet. On the benefit, variance only appears once there is a realized value.