The charts at the top of a Resource Dashboard show the make-up of the people in the view: for example, how many are permanent or contractors, which country they are based in, or which department they belong to. Each chart counts resources, and you can change both what it groups people by and how it is drawn.
This article explains how to customise the charts.
Open a Resource Dashboard
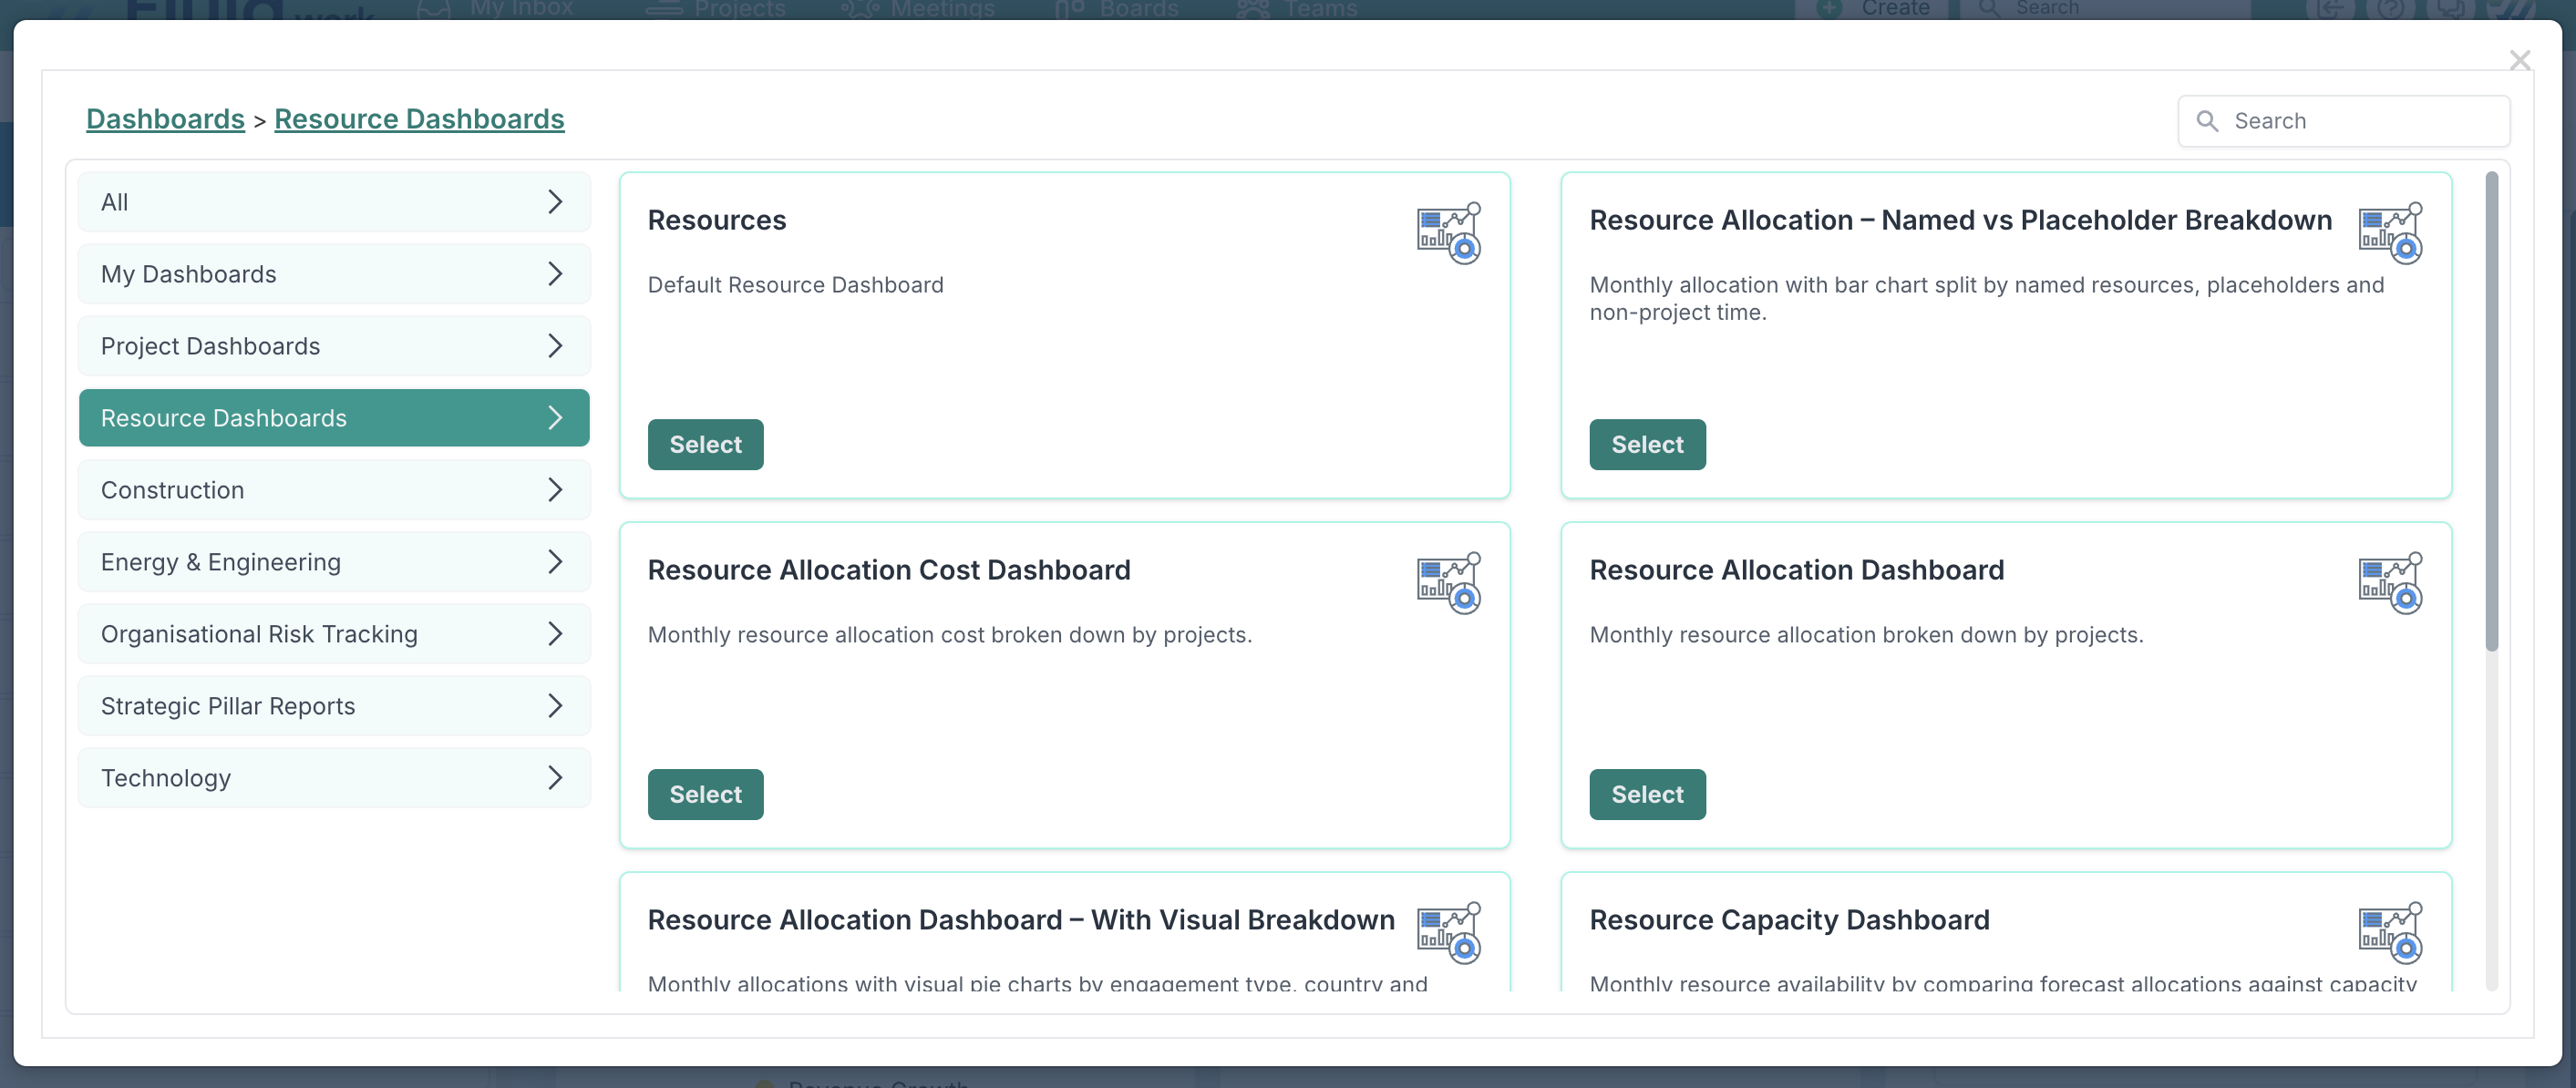
Go to a dashboard page, such as the project dashboard, and click Custom Dashboards at the top right.

In the dialog, choose Resource Dashboards on the left, then click Select on Resource Allocation Dashboard – With Visual Breakdown.
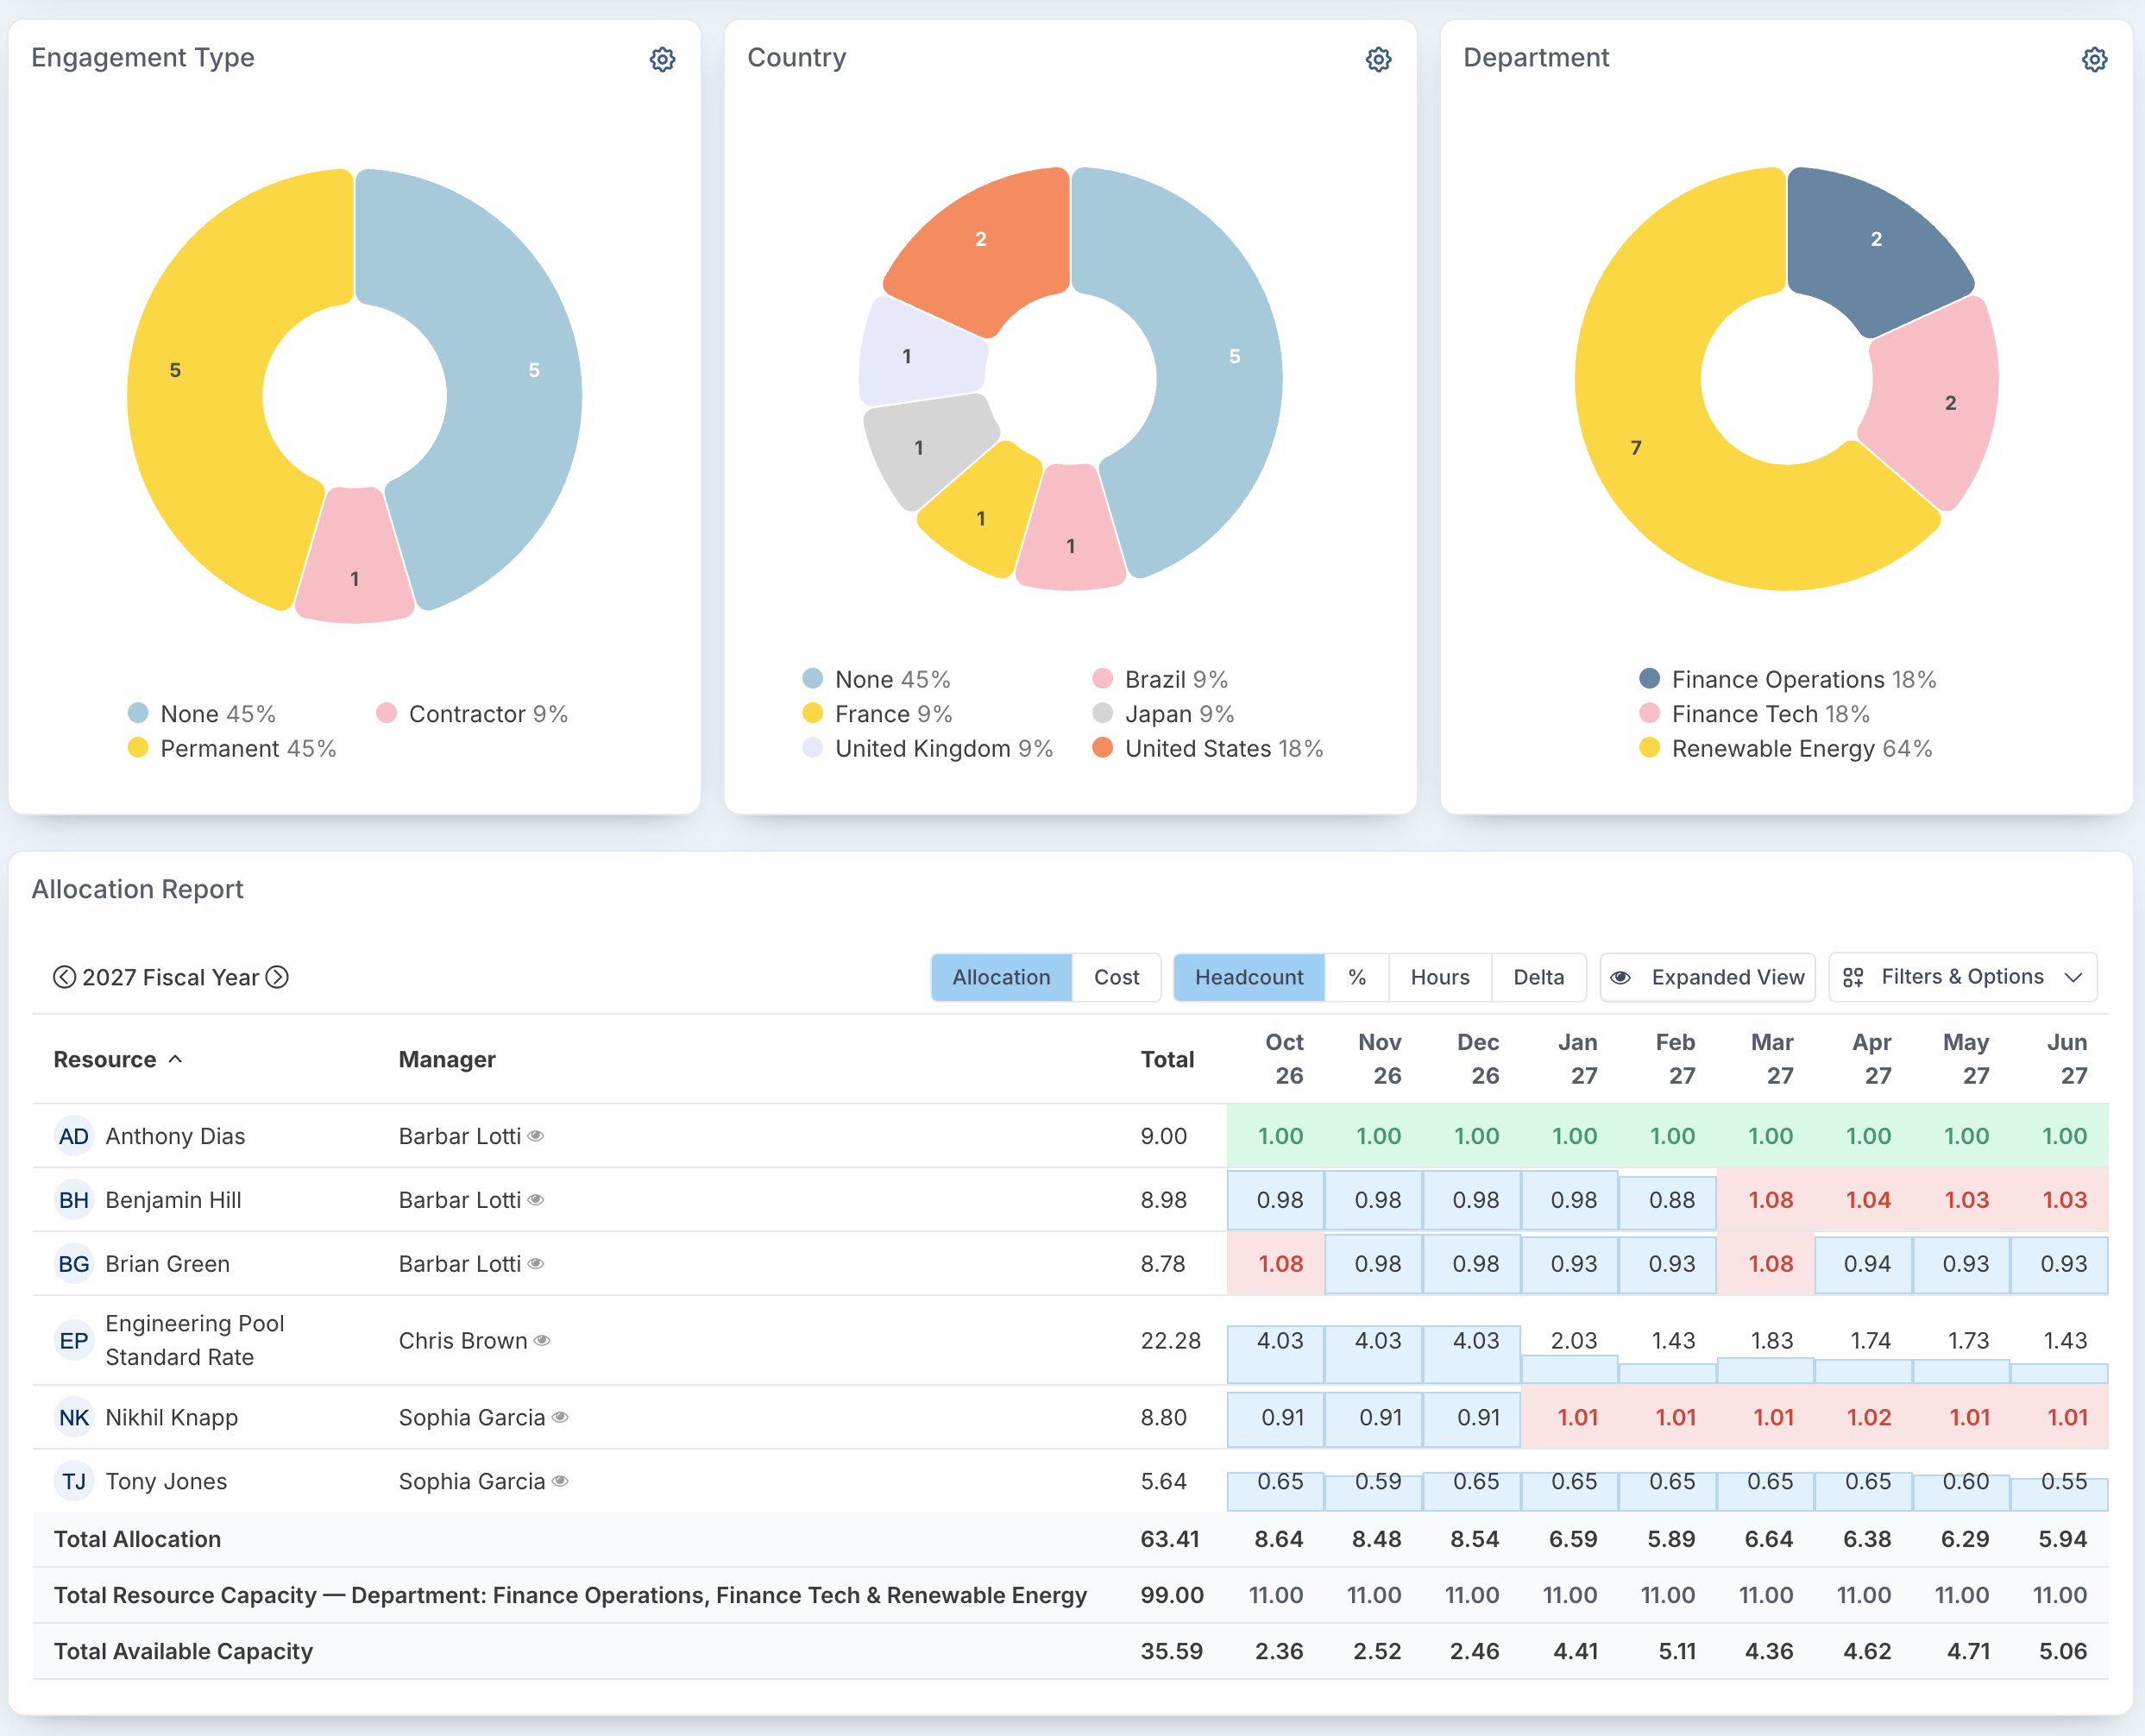
The dashboard opens with three charts above the allocation grid, by default Engagement Type, Country and Department. They reflect the filters applied to the dashboard, so they always describe the same people as the grid below.
Customise a chart
Click the settings icon (⚙) at the top right of the chart. Its settings open inside the chart card.
Choose how the chart is drawn: Pie, Bar or Column.
On the Series tab, choose what the chart groups people by. The list includes resource fields, such as Cost Centre, Country, Department, Division, Engagement Type, Region, Role, Skills or Team, and your person custom properties. Use Search to find one quickly. The field currently in use is shown under Grouped by.
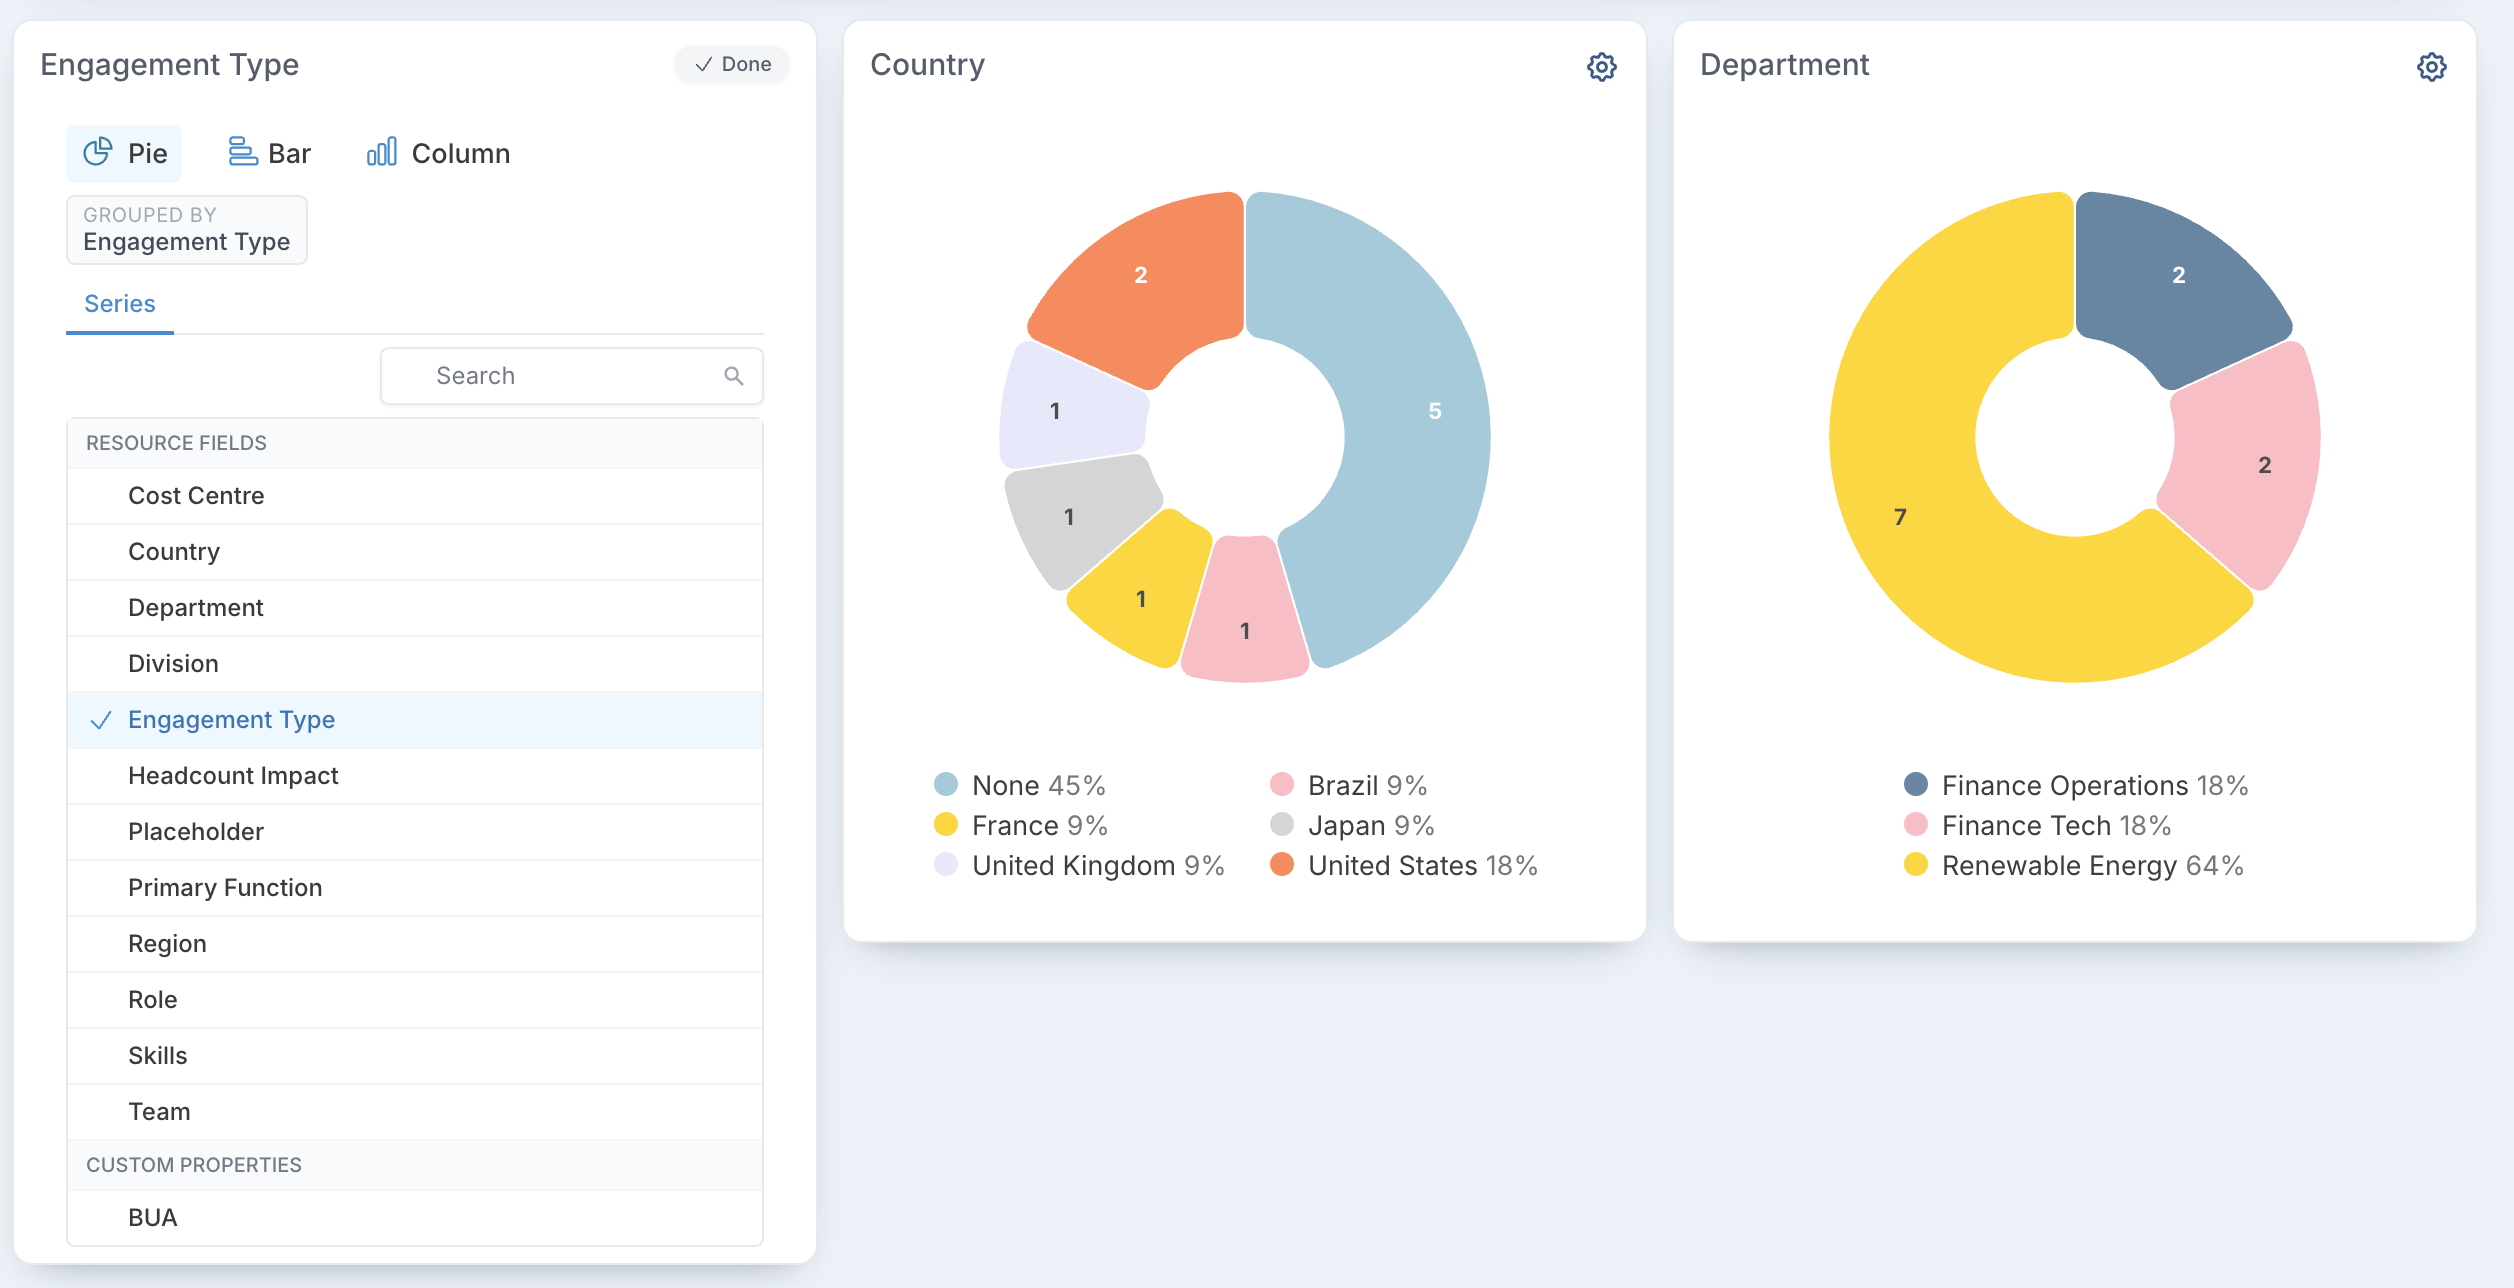
In the example below, the first chart is changed to group people by Role, drawn as a Bar chart.
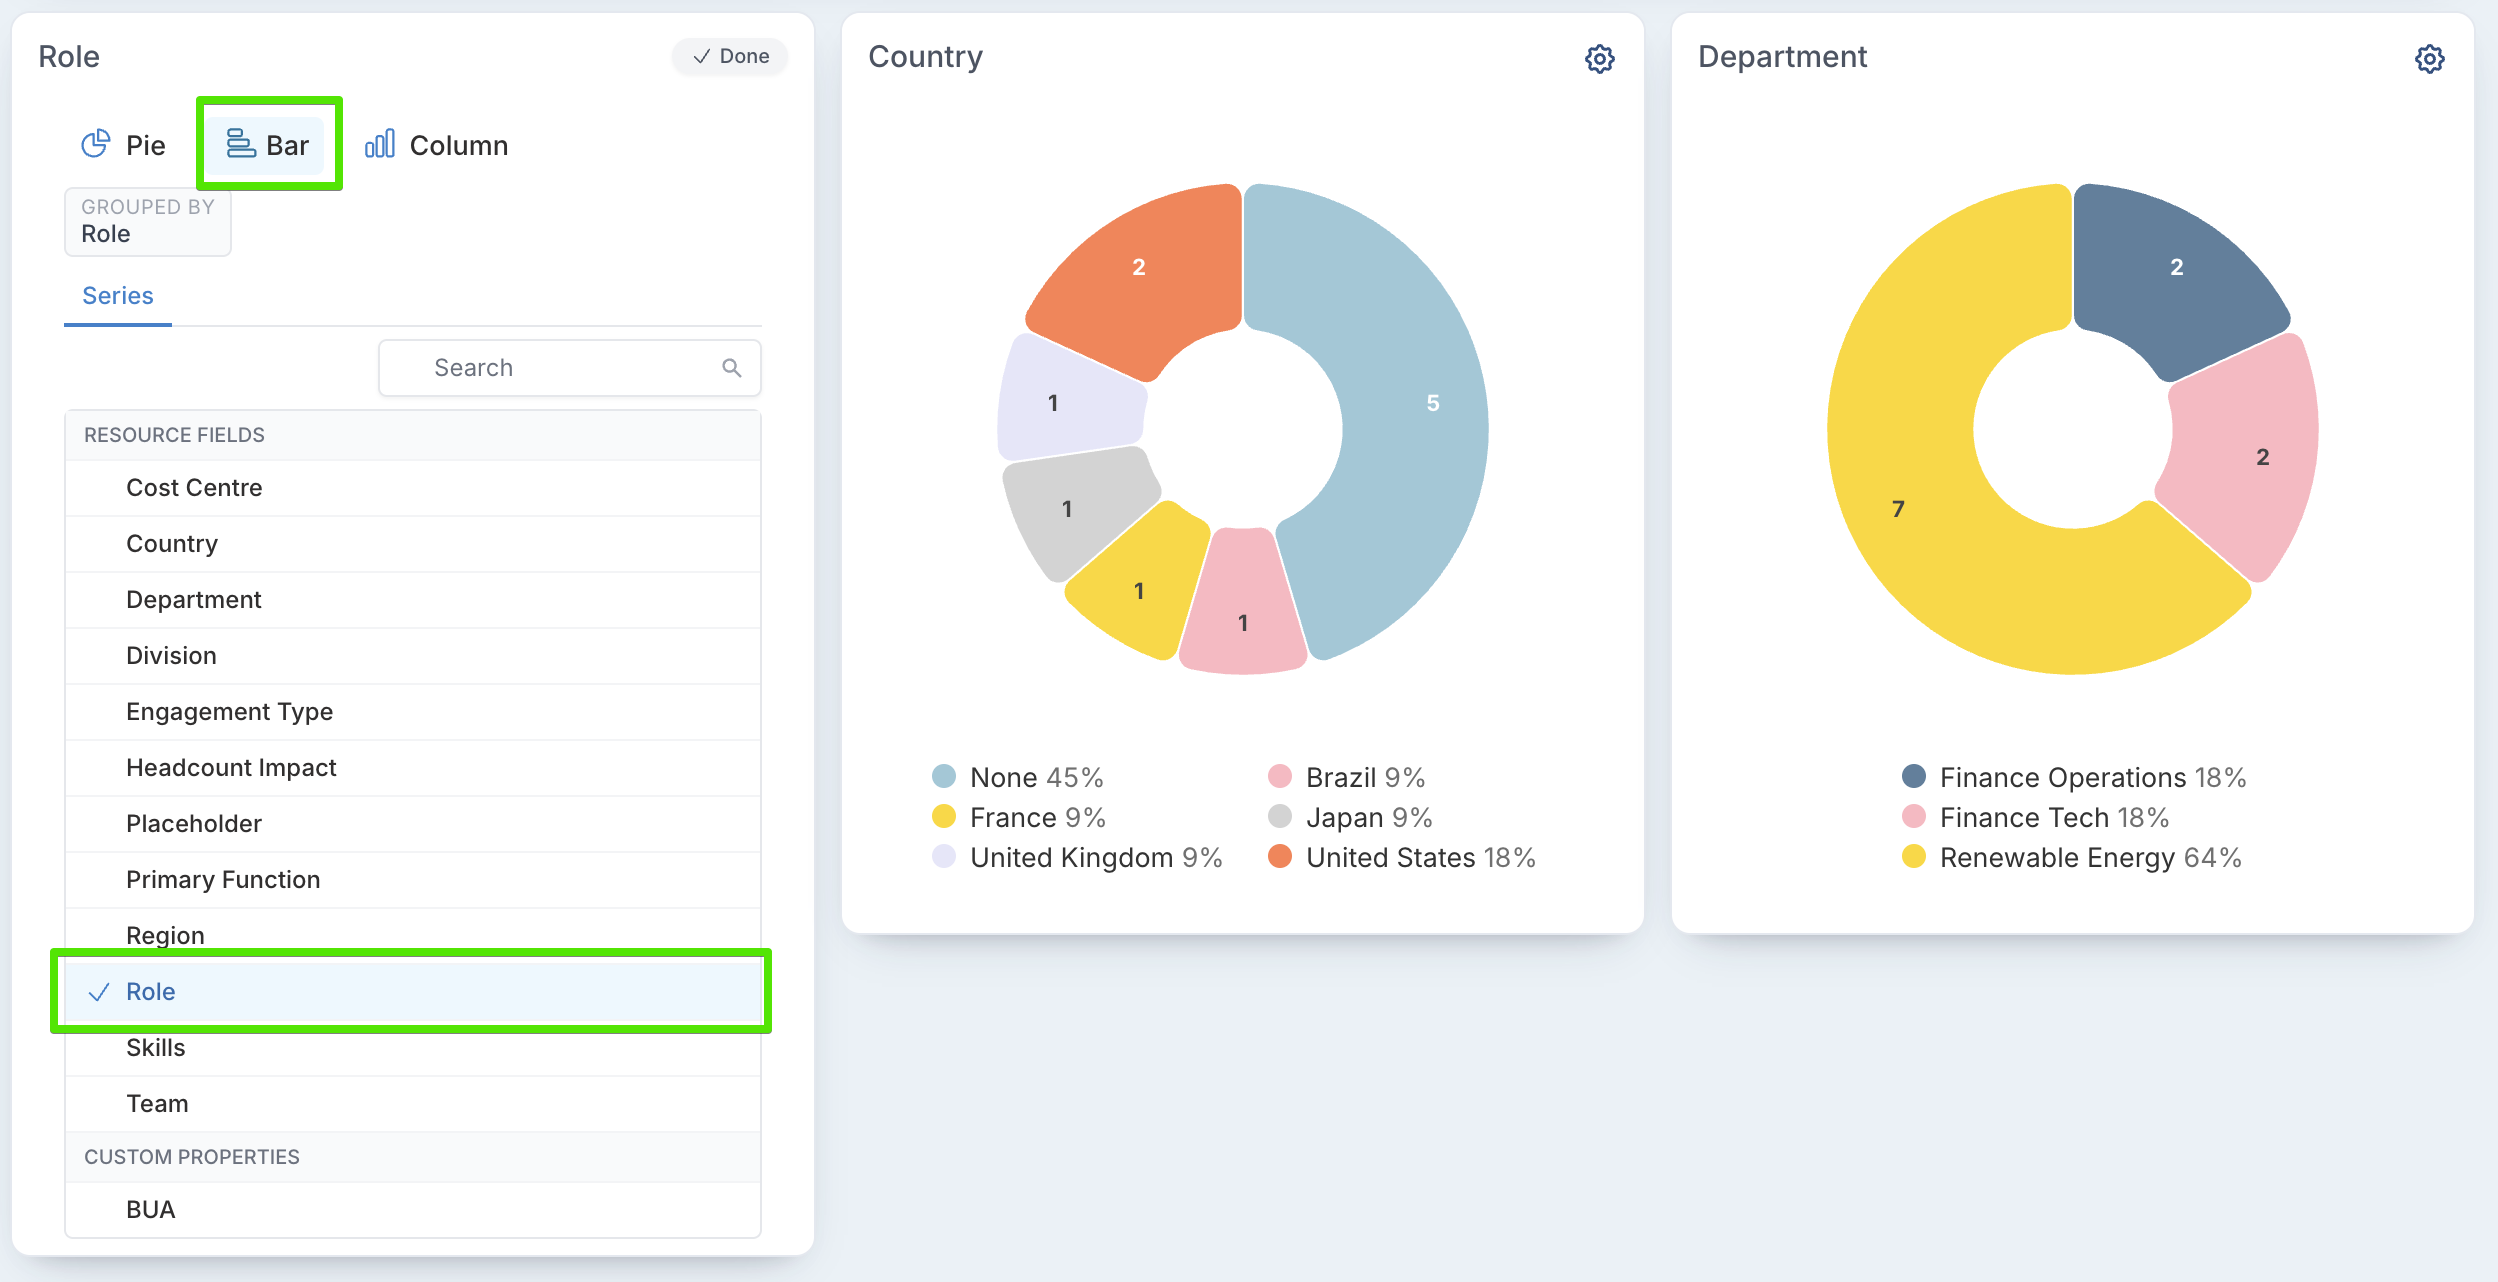
Click Done. The chart redraws with your choices.
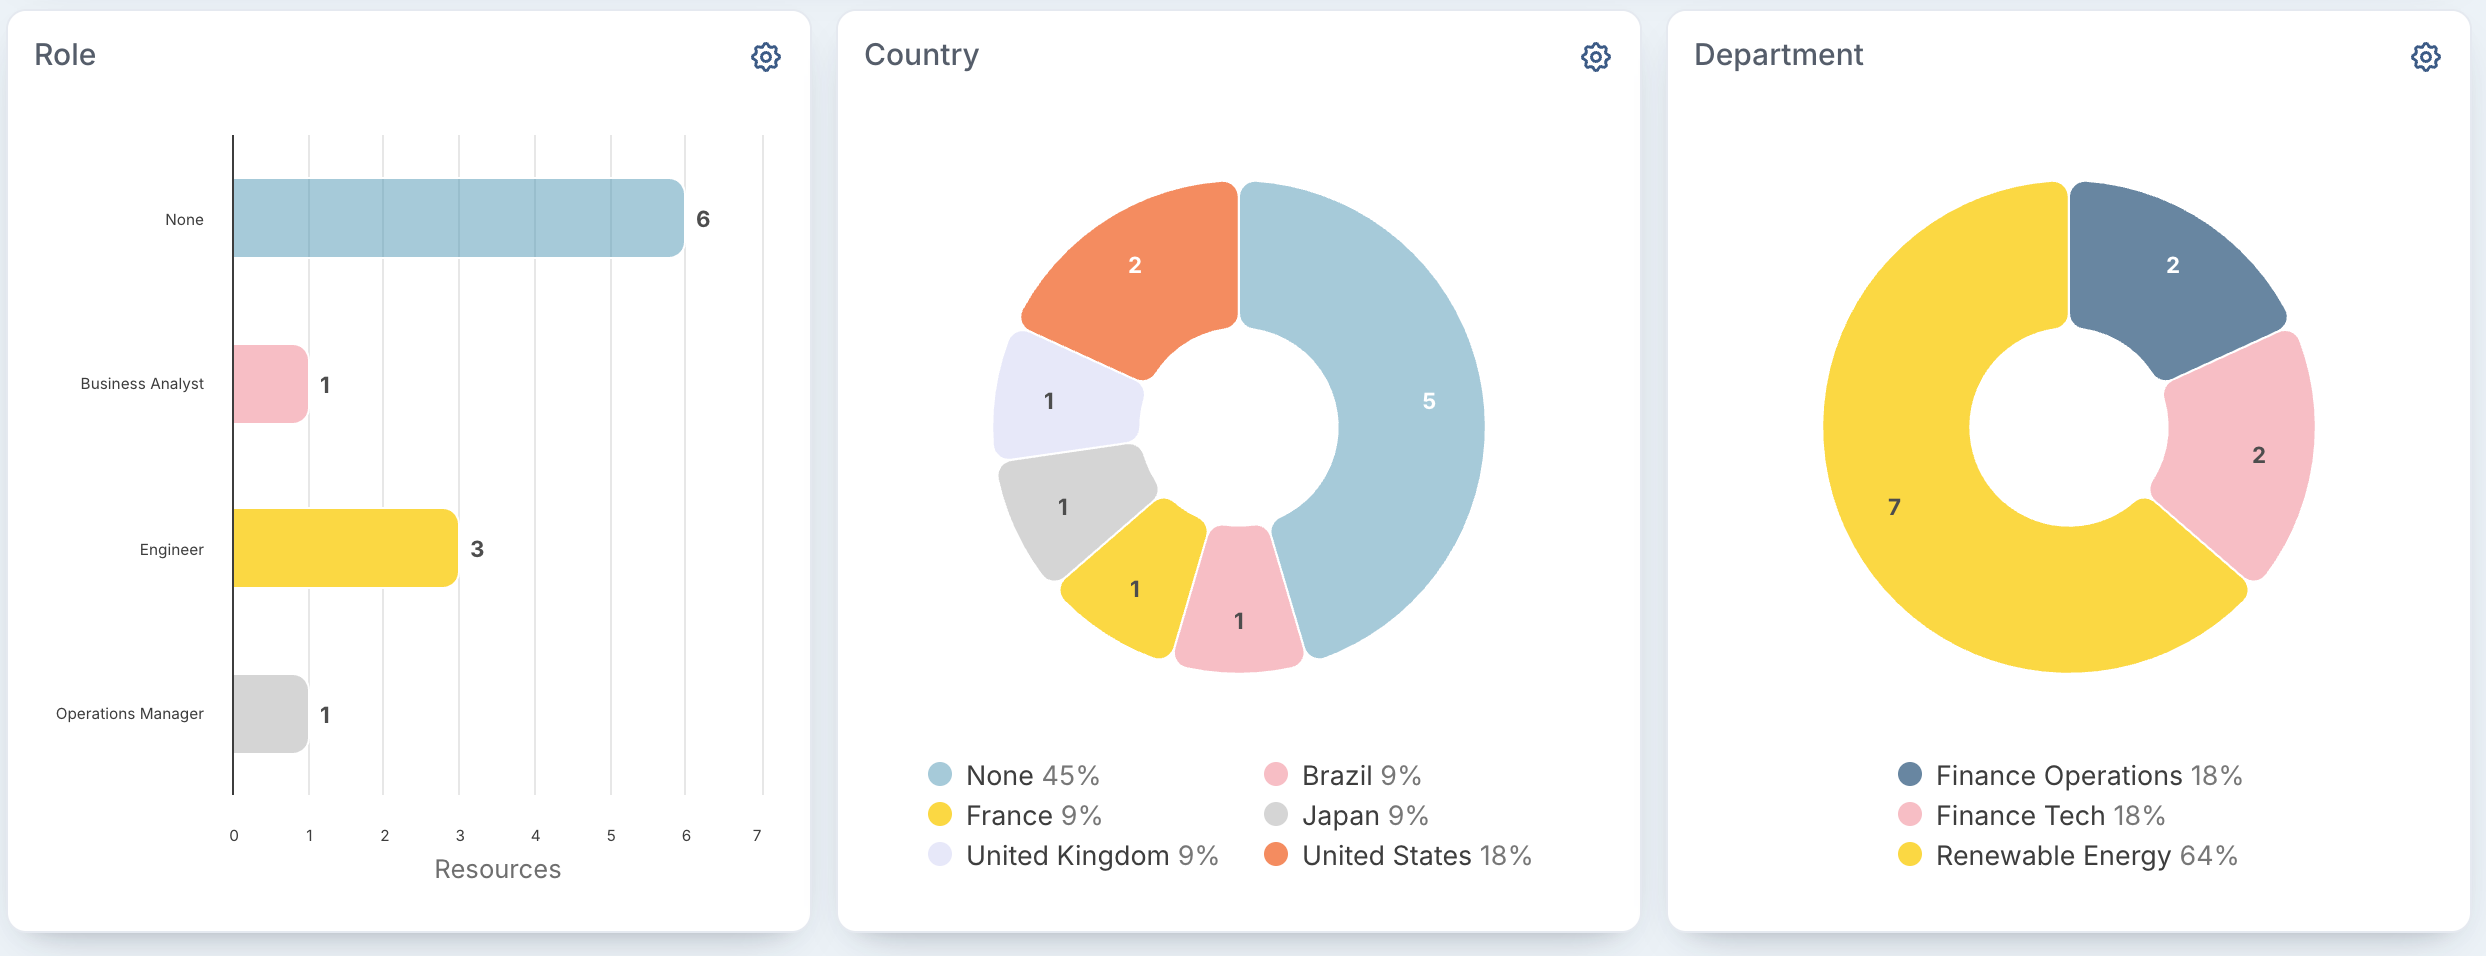
Here the chart now shows how many resources hold each role: one Business Analyst, three Engineers, one Operations Manager, and six with no role recorded.
Keep your changes
Your chart choices are kept in the page address, so a bookmarked or shared link opens with the same charts. To keep them as your own dashboard, click Save Dashboard at the top of the page.